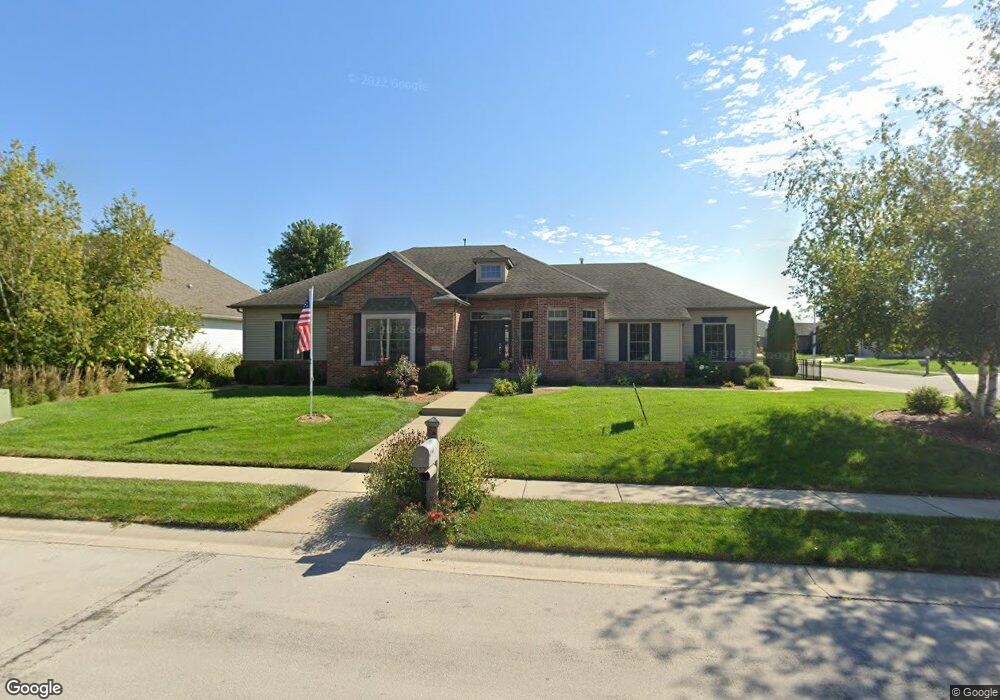
2812 Rutherford Trek Springfield, IL 62711
Estimated Value: $451,000 - $499,000
Studio
--
Bath
--
Sq Ft
13,155
Sq Ft Lot
About This Home
This home is located at 2812 Rutherford Trek, Springfield, IL 62711 and is currently estimated at $466,810. 2812 Rutherford Trek is a home located in Sangamon County with nearby schools including New Berlin Elementary School, New Berlin Jr High School, and Montessori School House of Springfield.
Ownership History
Date
Name
Owned For
Owner Type
Purchase Details
Closed on
Apr 28, 2025
Sold by
Davis Prince N and Davis Robin
Bought by
Nation Steven Wayne and Nation Janet M
Current Estimated Value
Home Financials for this Owner
Home Financials are based on the most recent Mortgage that was taken out on this home.
Original Mortgage
$305,000
Outstanding Balance
$300,549
Interest Rate
5.38%
Mortgage Type
New Conventional
Estimated Equity
$166,261
Purchase Details
Closed on
Sep 29, 2022
Sold by
Park Kevin and Park Amy
Bought by
Davis Prince N and Davis Robin
Home Financials for this Owner
Home Financials are based on the most recent Mortgage that was taken out on this home.
Original Mortgage
$408,132
Interest Rate
5.13%
Mortgage Type
VA
Purchase Details
Closed on
Mar 29, 2007
Purchase Details
Closed on
Jan 13, 2006
Create a Home Valuation Report for This Property
The Home Valuation Report is an in-depth analysis detailing your home's value as well as a comparison with similar homes in the area
Purchase History
| Date | Buyer | Sale Price | Title Company |
|---|---|---|---|
| Nation Steven Wayne | $455,000 | None Listed On Document | |
| Davis Prince N | $399,900 | -- | |
| -- | $310,000 | -- | |
| -- | $43,500 | -- |
Source: Public Records
Mortgage History
| Date | Status | Borrower | Loan Amount |
|---|---|---|---|
| Open | Nation Steven Wayne | $305,000 | |
| Previous Owner | Davis Prince N | $408,132 |
Source: Public Records
Tax History
| Year | Tax Paid | Tax Assessment Tax Assessment Total Assessment is a certain percentage of the fair market value that is determined by local assessors to be the total taxable value of land and additions on the property. | Land | Improvement |
|---|---|---|---|---|
| 2024 | $9,733 | $144,575 | $19,812 | $124,763 |
| 2023 | $9,248 | $132,056 | $18,096 | $113,960 |
| 2022 | $7,796 | $109,905 | $17,166 | $92,739 |
| 2021 | $7,553 | $105,790 | $16,523 | $89,267 |
| 2020 | $7,707 | $105,949 | $16,548 | $89,401 |
| 2019 | $7,612 | $105,579 | $16,490 | $89,089 |
| 2018 | $7,235 | $101,095 | $16,409 | $84,686 |
| 2017 | $7,149 | $99,788 | $16,197 | $83,591 |
| 2016 | $8,544 | $118,394 | $15,962 | $102,432 |
| 2015 | $8,463 | $116,978 | $15,771 | $101,207 |
| 2014 | $8,010 | $116,222 | $15,669 | $100,553 |
| 2013 | $8,011 | $111,434 | $15,669 | $95,765 |
Source: Public Records
Map
Nearby Homes
- 2816 Whiteside Place
- 5416 Jade Ln Unit LOT27
- 5416 Jade Ln Unit LOT29
- 5413 Jade Ln Unit LOT27
- 2813 Richardson Dr
- 5412 Jade Ln Unit LOT30
- 5412 Jade Ln Unit LOT31
- 5409 Jade Ln Unit LOT26
- 5405 Jade Ln Unit LOT25
- 5404 Jade Ln Unit LOT32
- 5401 Jade Ln Unit LOT24
- 5400 Jade Ln Unit LOT33
- 5220 Verdant Ln
- 5313 Jade Ln Unit LOT23
- 5312 Jade Ln Unit LOT34
- 5309 Jade Ln Unit LOT22
- 5308 Jade Ln Unit LOT35
- 5309 Verdant Ln Unit LOT44
- 5305 Jade Ln Unit LOT21
- 5308 Verdant Ln Unit LOT 7
- 2812 Rutherford Trek
- 2812 Rutherford Trek
- 2808 Rutherford Trek
- 2808 Rutherford Trek
- 5612 Legacy Ln
- 2804 Rutherford Trek
- 2804 Rutherford Trek
- 5608 Legacy Ln
- 2809 Rutherford Trek
- 2809 Rutherford Trek
- 2809 Rutherford Trek
- 5616 Legacy Ln
- 2805 Rutherford Trek
- 2800 Rutherford Trek
- 5620 Legacy Ln
- 2812 Covered Wagon Trl Lot#306
- 2812 Covered Wagon Trail
- 2801 Rutherford Trek Lot#310
- 2808 Covered Wagon Trail
- 5624 Legacy Ln
Your Personal Tour Guide
Ask me questions while you tour the home.