2812 SW 17th Place Unit 71 Cape Coral, FL 33914
Pelican NeighborhoodEstimated Value: $353,441 - $476,000
3
Beds
2
Baths
1,921
Sq Ft
$209/Sq Ft
Est. Value
About This Home
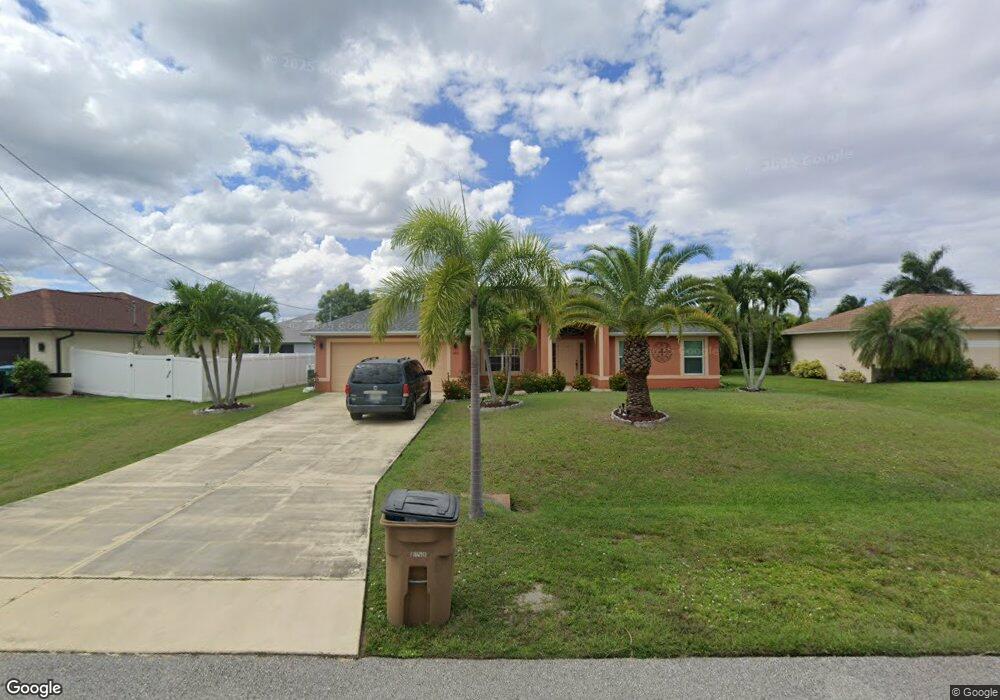
This home is located at 2812 SW 17th Place Unit 71, Cape Coral, FL 33914 and is currently estimated at $401,360, approximately $208 per square foot. 2812 SW 17th Place Unit 71 is a home located in Lee County with nearby schools including Cape Elementary School, Caloosa Elementary School, and Tropic Isles Elementary School.
Ownership History
Date
Name
Owned For
Owner Type
Purchase Details
Closed on
Dec 1, 2010
Sold by
Tritons Group Llc
Bought by
Deleon Norman
Current Estimated Value
Home Financials for this Owner
Home Financials are based on the most recent Mortgage that was taken out on this home.
Original Mortgage
$126,704
Outstanding Balance
$83,839
Interest Rate
4.25%
Mortgage Type
FHA
Estimated Equity
$317,521
Purchase Details
Closed on
Feb 25, 2009
Sold by
Elena Barreto Clara
Bought by
Tritons Group Llc
Purchase Details
Closed on
Dec 5, 2008
Sold by
Tejeda Miguel A and Tejeda Hildemarys
Bought by
Barreto Clara E
Home Financials for this Owner
Home Financials are based on the most recent Mortgage that was taken out on this home.
Original Mortgage
$60,000
Interest Rate
6.01%
Mortgage Type
Unknown
Purchase Details
Closed on
May 25, 2006
Sold by
Grumer Ana M
Bought by
Tejeda Miguel A and Tejeda Hildemarys
Create a Home Valuation Report for This Property
The Home Valuation Report is an in-depth analysis detailing your home's value as well as a comparison with similar homes in the area
Home Values in the Area
Average Home Value in this Area
Purchase History
| Date | Buyer | Sale Price | Title Company |
|---|---|---|---|
| Deleon Norman | $130,000 | Go Title Inc | |
| Tritons Group Llc | -- | None Available | |
| Barreto Clara E | $105,000 | Platinum Land Title Agency | |
| Tejeda Miguel A | $75,500 | None Available |
Source: Public Records
Mortgage History
| Date | Status | Borrower | Loan Amount |
|---|---|---|---|
| Open | Deleon Norman | $126,704 | |
| Previous Owner | Barreto Clara E | $60,000 |
Source: Public Records
Tax History Compared to Growth
Tax History
| Year | Tax Paid | Tax Assessment Tax Assessment Total Assessment is a certain percentage of the fair market value that is determined by local assessors to be the total taxable value of land and additions on the property. | Land | Improvement |
|---|---|---|---|---|
| 2025 | $5,841 | $275,673 | $88,825 | $186,848 |
| 2024 | $6,171 | $319,034 | $85,677 | $233,357 |
| 2023 | $6,171 | $266,551 | $0 | $0 |
| 2022 | $5,535 | $242,319 | $0 | $0 |
| 2021 | $5,045 | $220,615 | $34,000 | $186,615 |
| 2020 | $4,819 | $200,264 | $29,850 | $170,414 |
| 2019 | $5,398 | $187,338 | $24,100 | $163,238 |
| 2018 | $5,292 | $179,252 | $23,000 | $156,252 |
| 2017 | $5,204 | $172,012 | $16,000 | $156,012 |
| 2016 | $3,388 | $163,454 | $16,000 | $147,454 |
| 2015 | $3,435 | $140,698 | $10,000 | $130,698 |
| 2014 | -- | $128,801 | $7,900 | $120,901 |
| 2013 | -- | $114,289 | $4,700 | $109,589 |
Source: Public Records
Map
Nearby Homes
- 2731 SW 17th Place
- 2725 SW 18th Ave
- 2832 SW 17th Ave
- 1632 SW 28th Terrace
- 1812 SW 28th Ln
- 2902 SW 17th Ave
- 2708 SW 17th Ave Unit 31
- 1733 SW 29th Terrace
- 2709 SW 18th Ave
- 1824 SW 28th Ln
- 1817 SW 29th Terrace
- 1804 SW 29th Terrace
- 1819 SW 29th Terrace
- 1709 SW 30th St
- 1820 SW 29th Terrace
- 1635 SW 30th St
- 1605 SW 28th St
- 1732 SW 30th St
- 2910 Chiquita Blvd S
- 2622 SW 17th Ave
- 2808 SW 17th Place
- 2816 SW 17th Place
- 2815 SW 18th Ave
- 2811 SW 18th Ave
- 2804 SW 17th Place
- 2813 SW 17th Place
- 2819 SW 18th Ave
- 2807 SW 18th Ave
- 2817 SW 17th Place
- 2732 SW 17th Place
- 2821 SW 17th Place
- 1722 SW 28th Terrace
- 1726 SW 28th Terrace
- 2803 SW 18th Ave
- 1730 SW 28th Terrace
- 2812 SW 18th Ave
- 2816 SW 18th Ave
- 2729 SW 18th Ave Unit 92
- 1734 SW 28th Terrace
- 2802 SW 18th Ave