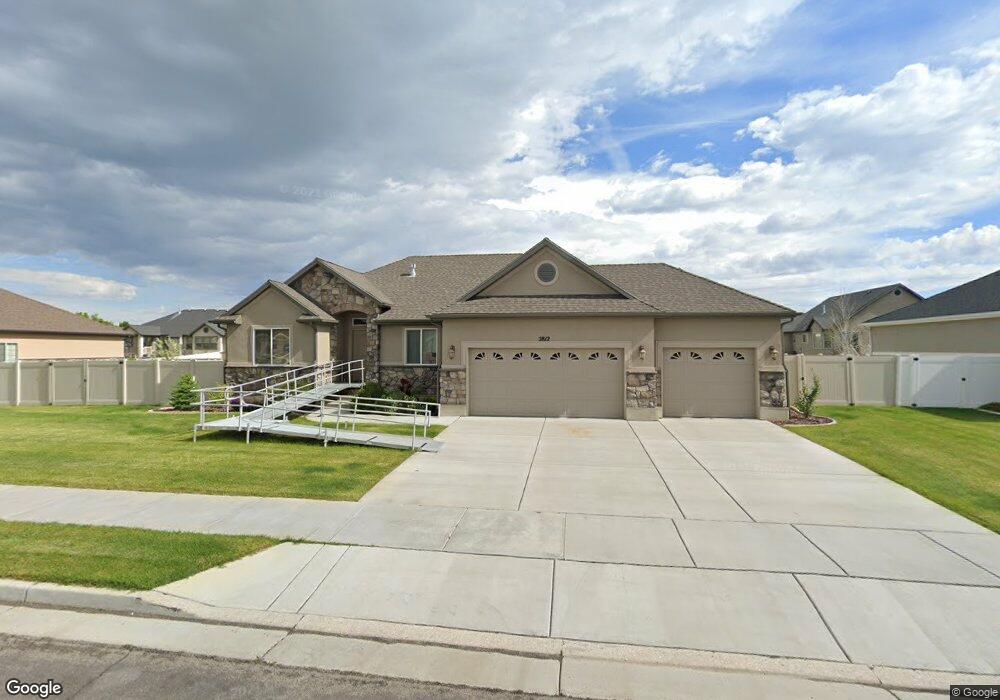
2812 W 50 S West Point, UT 84015
Estimated Value: $586,797 - $630,000
3
Beds
3
Baths
3,163
Sq Ft
$194/Sq Ft
Est. Value
About This Home
This home is located at 2812 W 50 S, West Point, UT 84015 and is currently estimated at $614,699, approximately $194 per square foot. 2812 W 50 S is a home located in Davis County with nearby schools including West Point School, West Point Junior High School, and Syracuse High School.
Ownership History
Date
Name
Owned For
Owner Type
Purchase Details
Closed on
Jun 14, 2019
Sold by
Hepper Tiffany
Bought by
Hepper Tiffany and The Tiffany A Hepper Living Tr
Current Estimated Value
Purchase Details
Closed on
Dec 17, 2012
Sold by
Ivory Homes Ltd
Bought by
Hepper Mark A and Hepper Tiffany
Home Financials for this Owner
Home Financials are based on the most recent Mortgage that was taken out on this home.
Original Mortgage
$273,852
Outstanding Balance
$50,383
Interest Rate
3.37%
Mortgage Type
VA
Estimated Equity
$564,316
Create a Home Valuation Report for This Property
The Home Valuation Report is an in-depth analysis detailing your home's value as well as a comparison with similar homes in the area
Home Values in the Area
Average Home Value in this Area
Purchase History
| Date | Buyer | Sale Price | Title Company |
|---|---|---|---|
| Hepper Tiffany | -- | None Available | |
| Hepper Mark A | -- | Cottonwood Title | |
| Ivory Homes Ltd | -- | Cottonwood Title |
Source: Public Records
Mortgage History
| Date | Status | Borrower | Loan Amount |
|---|---|---|---|
| Open | Hepper Mark A | $273,852 |
Source: Public Records
Tax History
| Year | Tax Paid | Tax Assessment Tax Assessment Total Assessment is a certain percentage of the fair market value that is determined by local assessors to be the total taxable value of land and additions on the property. | Land | Improvement |
|---|---|---|---|---|
| 2025 | -- | $303,600 | $115,457 | $188,143 |
| 2024 | -- | $303,050 | $103,932 | $199,118 |
| 2023 | $259 | $522,000 | $130,338 | $391,662 |
| 2022 | $259 | $308,551 | $68,019 | $240,532 |
| 2021 | $2,346 | $408,000 | $105,422 | $302,578 |
| 2020 | $2,346 | $355,000 | $88,719 | $266,281 |
| 2019 | $2,346 | $338,000 | $86,028 | $251,972 |
| 2018 | $2,346 | $319,000 | $85,690 | $233,310 |
| 2016 | $2,414 | $172,701 | $33,171 | $139,530 |
| 2015 | $2,401 | $161,151 | $33,171 | $127,980 |
| 2014 | $3,185 | $140,700 | $33,171 | $107,529 |
| 2013 | -- | $66,388 | $66,388 | $0 |
Source: Public Records
Map
Nearby Homes
Your Personal Tour Guide
Ask me questions while you tour the home.