Estimated Value: $296,000 - $333,000
4
Beds
3
Baths
2,126
Sq Ft
$148/Sq Ft
Est. Value
About This Home
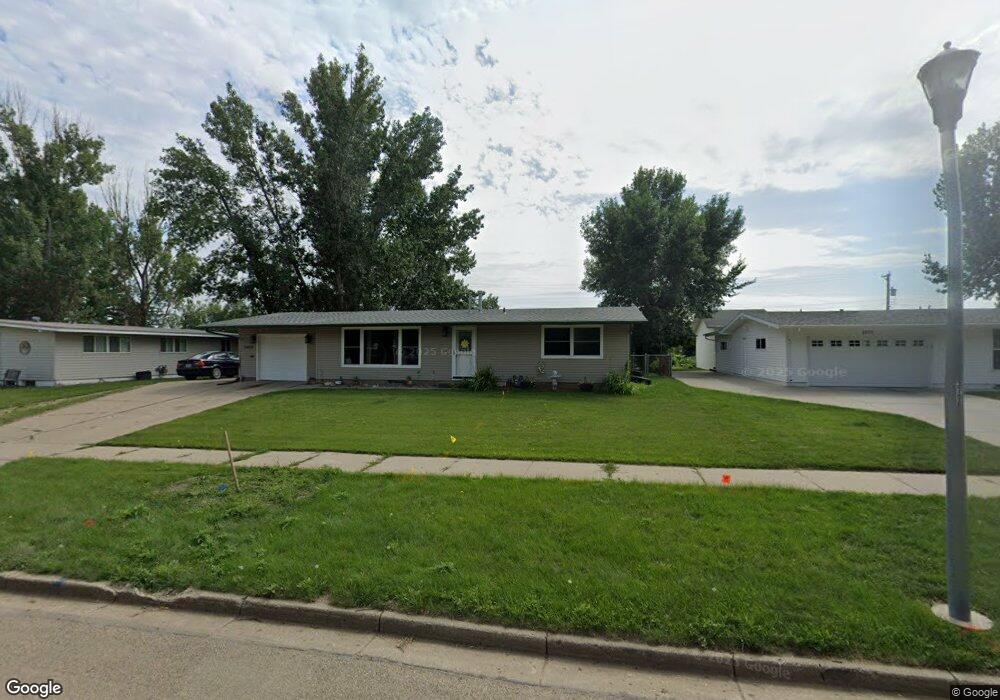
This home is located at 2813 2nd Ave SW, Minot, ND 58701 and is currently estimated at $313,880, approximately $147 per square foot. 2813 2nd Ave SW is a home located in Ward County with nearby schools including Perkett Elementary School, Jim Hill Middle School, and Magic City Campus High School.
Ownership History
Date
Name
Owned For
Owner Type
Purchase Details
Closed on
Jan 3, 2014
Sold by
Voeller Dustin K and Voeller Julie A
Bought by
Lundeen Jonah and Lundeen Heidi
Current Estimated Value
Home Financials for this Owner
Home Financials are based on the most recent Mortgage that was taken out on this home.
Original Mortgage
$194,400
Interest Rate
4.23%
Mortgage Type
New Conventional
Purchase Details
Closed on
May 27, 2009
Sold by
Durso Samuel A and Durso Angela
Bought by
Voeller Dustin K and Blessum Julie A
Home Financials for this Owner
Home Financials are based on the most recent Mortgage that was taken out on this home.
Original Mortgage
$152,910
Interest Rate
4.84%
Mortgage Type
New Conventional
Purchase Details
Closed on
Jun 21, 2005
Sold by
Deyoung Steven and Deyoung Cynthia
Bought by
Durso Samuel A and Durso Angela
Home Financials for this Owner
Home Financials are based on the most recent Mortgage that was taken out on this home.
Original Mortgage
$139,455
Interest Rate
5.66%
Mortgage Type
VA
Create a Home Valuation Report for This Property
The Home Valuation Report is an in-depth analysis detailing your home's value as well as a comparison with similar homes in the area
Home Values in the Area
Average Home Value in this Area
Purchase History
| Date | Buyer | Sale Price | Title Company |
|---|---|---|---|
| Lundeen Jonah | -- | None Available | |
| Voeller Dustin K | -- | None Available | |
| Durso Samuel A | -- | None Available |
Source: Public Records
Mortgage History
| Date | Status | Borrower | Loan Amount |
|---|---|---|---|
| Closed | Lundeen Jonah | $194,400 | |
| Previous Owner | Voeller Dustin K | $152,910 | |
| Previous Owner | Durso Samuel A | $139,455 |
Source: Public Records
Tax History Compared to Growth
Tax History
| Year | Tax Paid | Tax Assessment Tax Assessment Total Assessment is a certain percentage of the fair market value that is determined by local assessors to be the total taxable value of land and additions on the property. | Land | Improvement |
|---|---|---|---|---|
| 2024 | $4,719 | $148,000 | $30,500 | $117,500 |
| 2023 | $4,916 | $149,500 | $30,500 | $119,000 |
| 2022 | $4,095 | $130,500 | $22,500 | $108,000 |
| 2021 | $3,546 | $117,500 | $22,500 | $95,000 |
| 2020 | $3,410 | $114,000 | $22,500 | $91,500 |
| 2019 | $3,465 | $114,000 | $22,500 | $91,500 |
| 2018 | $3,429 | $114,000 | $22,500 | $91,500 |
| 2017 | $3,163 | $114,000 | $25,000 | $89,000 |
| 2016 | $2,498 | $111,500 | $25,000 | $86,500 |
| 2015 | $2,758 | $111,500 | $0 | $0 |
| 2014 | $2,758 | $109,500 | $0 | $0 |
Source: Public Records
Map
Nearby Homes
- 145 26th St SW
- 2510 2nd Ave SW
- 117 26th St SW
- 2416 2nd Ave SW Unit Minot
- 108 24th St SW
- 18 24th St SW
- 416 22nd St SW
- 100 21st St NW
- 1709 5th Ave SW
- 2201 7th Ave NW
- 221 17th St NW
- 514 16th St SW
- 916 26th St NW
- 516 Forest Rd
- 516 19th St NW
- 420 16th St NW
- 2544 10th Ave NW
- 1714 University Ave W
- 200 11th St SW
- 509 13th St NW
- 2809 2nd Ave SW
- 2909 2nd Ave SW
- 2805 2nd Ave SW
- 2812 2nd Ave SW
- 2801 2nd Ave SW
- 2900 2nd Ave SW
- 2910 2nd Ave SW
- 138 28th St SW
- 2914 2nd Ave SW
- 2921 2nd Ave SW
- 2705 2nd Ave SW
- 136 28th St SW
- 2849 1st Ave SW
- 2909 1st Ave SW
- 2701 2nd Ave SW
- 101 30th St SW
- 137 28th St SW
- 2845 1st Ave SW
- 132 28th St SW
- 3000 2nd Ave SW