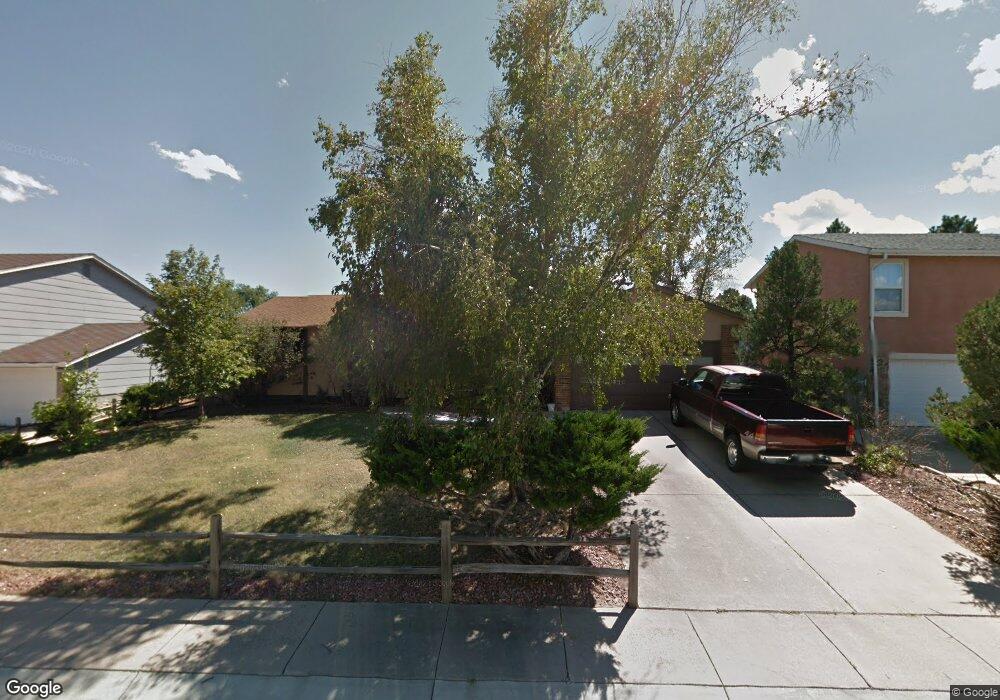
2813 Buttermilk Cir Colorado Springs, CO 80918
Norwood NeighborhoodEstimated Value: $434,038 - $455,000
5
Beds
1
Bath
1,443
Sq Ft
$310/Sq Ft
Est. Value
About This Home
This home is located at 2813 Buttermilk Cir, Colorado Springs, CO 80918 and is currently estimated at $446,760, approximately $309 per square foot. 2813 Buttermilk Cir is a home located in El Paso County with nearby schools including King Elementary School, Russell Middle School, and Doherty High School.
Ownership History
Date
Name
Owned For
Owner Type
Purchase Details
Closed on
Nov 14, 2022
Sold by
Cedar Bank Housing Finance Agency
Bought by
Cedar Band Housing Finance Agency
Current Estimated Value
Home Financials for this Owner
Home Financials are based on the most recent Mortgage that was taken out on this home.
Original Mortgage
$405,982
Outstanding Balance
$389,786
Interest Rate
5.54%
Mortgage Type
FHA
Estimated Equity
$56,974
Purchase Details
Closed on
Aug 22, 2022
Sold by
Cedar Band Housing Finance Agency
Bought by
Garcia Ovidio Armando Este
Home Financials for this Owner
Home Financials are based on the most recent Mortgage that was taken out on this home.
Original Mortgage
$405,982
Interest Rate
5.3%
Mortgage Type
FHA
Purchase Details
Closed on
Nov 21, 1990
Bought by
Mcdonald Sharon L
Purchase Details
Closed on
Oct 1, 1978
Bought by
Mcdonald Sharon L
Create a Home Valuation Report for This Property
The Home Valuation Report is an in-depth analysis detailing your home's value as well as a comparison with similar homes in the area
Home Values in the Area
Average Home Value in this Area
Purchase History
| Date | Buyer | Sale Price | Title Company |
|---|---|---|---|
| Cedar Band Housing Finance Agency | -- | Land Title Guarantee | |
| Garcia Ovidio Armando Este | -- | -- | |
| Cedar Bank Housing Finance Agency | $420,000 | Guaranty Land Title | |
| Mcdonald Sharon L | -- | -- | |
| Mcdonald Sharon L | -- | -- |
Source: Public Records
Mortgage History
| Date | Status | Borrower | Loan Amount |
|---|---|---|---|
| Open | Cedar Band Housing Finance Agency | $405,982 | |
| Previous Owner | Cedar Bank Housing Finance Agency | $405,982 |
Source: Public Records
Tax History Compared to Growth
Tax History
| Year | Tax Paid | Tax Assessment Tax Assessment Total Assessment is a certain percentage of the fair market value that is determined by local assessors to be the total taxable value of land and additions on the property. | Land | Improvement |
|---|---|---|---|---|
| 2025 | $1,480 | $31,160 | -- | -- |
| 2024 | $1,365 | $31,050 | $5,700 | $25,350 |
| 2022 | $893 | $22,900 | $5,060 | $17,840 |
| 2021 | $969 | $23,570 | $5,210 | $18,360 |
| 2020 | $715 | $17,690 | $4,530 | $13,160 |
| 2019 | $712 | $17,690 | $4,530 | $13,160 |
| 2018 | $571 | $14,980 | $3,810 | $11,170 |
| 2017 | $541 | $14,980 | $3,810 | $11,170 |
| 2016 | $440 | $15,170 | $3,940 | $11,230 |
| 2015 | $438 | $15,170 | $3,940 | $11,230 |
| 2014 | $830 | $13,790 | $3,890 | $9,900 |
Source: Public Records
Map
Nearby Homes
- 2982 Buttermilk Cir
- 2815 Downhill Dr
- 2810 Downhill Dr
- 6205 MacH 1 Dr
- 5831 New Crossings Point
- 2840 Purgatory Dr
- 5823 New Crossings Point
- 2860 Purgatory Dr
- 2750 Purgatory Dr
- 2940 Purgatory Dr
- 5803 New Crossings Point
- 5888 Eldora Dr
- 5915 Eldora Ln
- 5850 Del Paz Dr
- 5926 Del Paz Dr
- 6025 Powder Keg Place
- 3045 Dublin Blvd
- 3275 Bell Mountain Dr
- 6028 Copper Mountain Dr
- 6035 Tuckerman Ln
- 2821 Buttermilk Cir
- 2805 Buttermilk Cir
- 6055 N Union Blvd
- 2829 Buttermilk Cir
- 2998 Buttermilk Cir
- 6105 N Union Blvd
- 6105 R N Union Blvd
- 2806 Buttermilk Cir
- 6045 N Union Blvd
- 2982 Keystone Cir
- 2974 Keystone Cir
- 2837 Buttermilk Cir
- 2995 Buttermilk Cir
- 2990 Buttermilk Cir
- 6125 N Union Blvd
- 6035 N Union Blvd
- 2990 Keystone Cir
- 2966 Keystone Cir
- 2840 Buttermilk Cir
- 2845 Buttermilk Cir