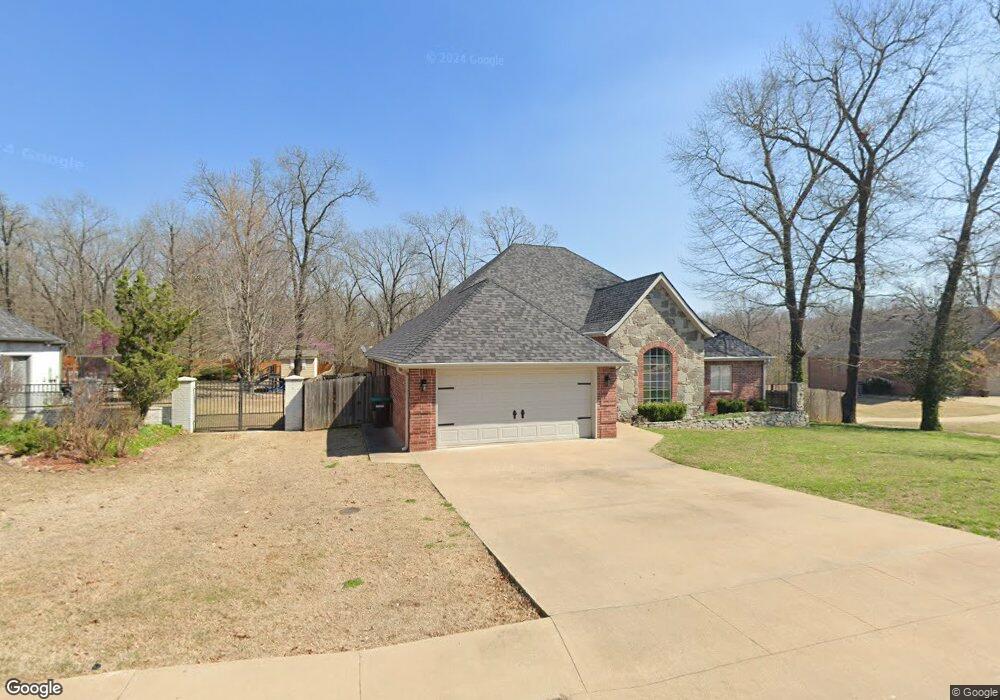
2813 Cambridge Cir Tahlequah, OK 74464
Estimated Value: $404,000 - $470,000
4
Beds
3
Baths
2,504
Sq Ft
$173/Sq Ft
Est. Value
About This Home
This home is located at 2813 Cambridge Cir, Tahlequah, OK 74464 and is currently estimated at $433,361, approximately $173 per square foot. 2813 Cambridge Cir is a home located in Cherokee County with nearby schools including Heritage Elementary School, Tahlequah Middle School, and Tahlequah High School.
Ownership History
Date
Name
Owned For
Owner Type
Purchase Details
Closed on
Sep 16, 2020
Sold by
Madewell Susan A and Madewell Susan A
Bought by
Robinson Robert C and Robinson Jessica
Current Estimated Value
Home Financials for this Owner
Home Financials are based on the most recent Mortgage that was taken out on this home.
Original Mortgage
$283,221
Outstanding Balance
$250,295
Interest Rate
2.8%
Mortgage Type
FHA
Estimated Equity
$183,066
Purchase Details
Closed on
Dec 20, 2019
Sold by
Martin Chris and Martin Jessica
Bought by
Susan A Madewell Revocable Trust
Purchase Details
Closed on
Aug 1, 2006
Sold by
Varner Scott M and Varner Monica K
Bought by
Martin Chris
Purchase Details
Closed on
Oct 26, 2005
Sold by
Wilson Land Development Llc
Bought by
Varner Scott M and Varner Monica K
Create a Home Valuation Report for This Property
The Home Valuation Report is an in-depth analysis detailing your home's value as well as a comparison with similar homes in the area
Home Values in the Area
Average Home Value in this Area
Purchase History
| Date | Buyer | Sale Price | Title Company |
|---|---|---|---|
| Robinson Robert C | $293,000 | Tahlequah Abstract & Ttl Co | |
| Susan A Madewell Revocable Trust | $235,000 | Tahlequah Abstract & Ttl Co | |
| Martin Chris | $204,500 | Cherokee Capitol Abstract & | |
| Varner Scott M | $26,500 | Cherokee Capitol Closing Ser |
Source: Public Records
Mortgage History
| Date | Status | Borrower | Loan Amount |
|---|---|---|---|
| Open | Robinson Robert C | $283,221 |
Source: Public Records
Tax History Compared to Growth
Tax History
| Year | Tax Paid | Tax Assessment Tax Assessment Total Assessment is a certain percentage of the fair market value that is determined by local assessors to be the total taxable value of land and additions on the property. | Land | Improvement |
|---|---|---|---|---|
| 2025 | $3,207 | $35,534 | $4,572 | $30,962 |
| 2024 | $3,207 | $33,842 | $4,354 | $29,488 |
| 2023 | $3,207 | $32,230 | $3,850 | $28,380 |
| 2022 | $2,990 | $32,230 | $3,850 | $28,380 |
| 2021 | $3,001 | $32,230 | $3,850 | $28,380 |
| 2020 | $2,451 | $25,850 | $3,850 | $22,000 |
| 2019 | $2,687 | $28,600 | $3,850 | $24,750 |
| 2018 | $2,589 | $27,238 | $3,850 | $23,388 |
| 2017 | $2,471 | $26,041 | $3,850 | $22,191 |
| 2016 | $2,368 | $24,801 | $3,850 | $20,951 |
| 2015 | $2,117 | $23,620 | $3,850 | $19,770 |
| 2014 | $2,117 | $22,495 | $3,850 | $18,645 |
Source: Public Records
Map
Nearby Homes
- 17792 E 684 Rd
- 890 E Harlan Dr
- 2570 Ambers Way
- 874 E Harlan Dr
- 856 E Harlan Dr
- 2583 Ambers Way
- 824 E Harlan Dr
- 710 Jeffrey St
- 3270 Cypress Ln
- 1010 Wilcox Cir
- 870 Cherry Springs Dr
- 3244 Cypress Ln
- 3266 Cypress Ln
- 2463 S Park Hill Rd
- 768 E Harlan Dr
- 857 Crestview
- 848 Crestview
- 14351 U S Highway 62
- 16133 U S Highway 62
- 1065 Edgewater
- 2870 Cambridge Cir
- 2724 Cambridge Cir
- 2827 Cambridge Cir
- 2603 Cambridge Cir
- 2507 Cambridge Cir
- 2487 Cambridge Cir
- 2664 Cambridge Cir
- 2948 Cambridge Cir
- 2854 Cambridge Cir
- 2664 Cambridge Cir
- 2644 Cambridge Cir
- 2528 Cambridge Cir
- 2917 Cambridge Cir
- 2871 Cambridge Cir
- 2855 Cambridge Cir
- 2795 Cambridge Cir
- 2755 Cambridge Cir
- 2705 Cambridge Cir
- 2685 Cambridge Cir