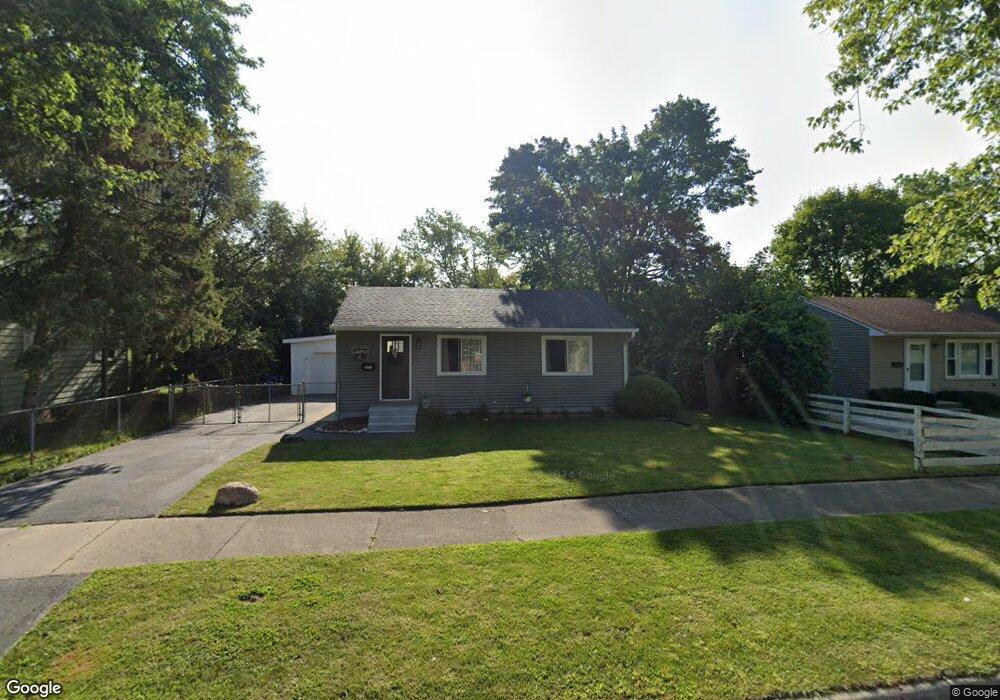
2813 N Pine St Waukegan, IL 60087
Lake County Gardens NeighborhoodEstimated Value: $186,000 - $220,720
2
Beds
1
Bath
768
Sq Ft
$265/Sq Ft
Est. Value
About This Home
This home is located at 2813 N Pine St, Waukegan, IL 60087 and is currently estimated at $203,180, approximately $264 per square foot. 2813 N Pine St is a home located in Lake County with nearby schools including Little Fort Elementary School, Jack Benny Middle School, and Waukegan High School.
Ownership History
Date
Name
Owned For
Owner Type
Purchase Details
Closed on
May 28, 2012
Sold by
Conn Elizabeth M
Bought by
Anguiano Roberto
Current Estimated Value
Home Financials for this Owner
Home Financials are based on the most recent Mortgage that was taken out on this home.
Original Mortgage
$68,850
Outstanding Balance
$47,872
Interest Rate
3.9%
Mortgage Type
New Conventional
Estimated Equity
$155,308
Purchase Details
Closed on
Nov 28, 2007
Sold by
Gomez Tomas J
Bought by
Conn Elizabeth M
Home Financials for this Owner
Home Financials are based on the most recent Mortgage that was taken out on this home.
Original Mortgage
$40,000
Interest Rate
6.33%
Mortgage Type
Purchase Money Mortgage
Purchase Details
Closed on
Mar 27, 2007
Sold by
Wells Fargo Bank Na
Bought by
Gomez Thomas J
Purchase Details
Closed on
Oct 26, 2006
Sold by
Cardoza Rafael and Case #06 Ch 487
Bought by
Wells Fargo Bank Na and Asset Backed Pass Through Cert Series 20
Create a Home Valuation Report for This Property
The Home Valuation Report is an in-depth analysis detailing your home's value as well as a comparison with similar homes in the area
Home Values in the Area
Average Home Value in this Area
Purchase History
| Date | Buyer | Sale Price | Title Company |
|---|---|---|---|
| Anguiano Roberto | $76,500 | Fidelity National Title | |
| Conn Elizabeth M | $141,000 | None Available | |
| Gomez Thomas J | $65,000 | Ticor | |
| Wells Fargo Bank Na | -- | None Available |
Source: Public Records
Mortgage History
| Date | Status | Borrower | Loan Amount |
|---|---|---|---|
| Open | Anguiano Roberto | $68,850 | |
| Previous Owner | Conn Elizabeth M | $40,000 |
Source: Public Records
Tax History Compared to Growth
Tax History
| Year | Tax Paid | Tax Assessment Tax Assessment Total Assessment is a certain percentage of the fair market value that is determined by local assessors to be the total taxable value of land and additions on the property. | Land | Improvement |
|---|---|---|---|---|
| 2024 | $4,931 | $66,746 | $14,413 | $52,333 |
| 2023 | $4,387 | $60,297 | $13,020 | $47,277 |
| 2022 | $4,387 | $50,878 | $15,168 | $35,710 |
| 2021 | $4,004 | $44,404 | $13,133 | $31,271 |
| 2020 | $4,009 | $41,368 | $12,235 | $29,133 |
| 2019 | $3,982 | $37,907 | $11,211 | $26,696 |
| 2018 | $3,390 | $32,598 | $13,361 | $19,237 |
| 2017 | $3,249 | $28,840 | $11,821 | $17,019 |
| 2016 | $2,946 | $25,061 | $10,272 | $14,789 |
| 2015 | $2,775 | $22,430 | $9,194 | $13,236 |
| 2014 | $3,413 | $25,711 | $11,353 | $14,358 |
| 2012 | $4,450 | $27,856 | $12,300 | $15,556 |
Source: Public Records
Map
Nearby Homes
- 1612 Whitney St
- 1636 Rice St
- 2613 N Lewis Ave
- 2350 N Lewis Ave
- 37905 N Loyola Ave
- 2232 Walnut St
- 301 W Eagle Ct
- 37966 N Cornell Rd
- 0 Traditions Dr
- 3211 Rugby Ct
- 38362 N Manor Ave
- 38127 N Shore Ave
- 3411 N Lewis Ave
- 10241 W Bairstow Ave
- 1905 Linden Ave
- 3101 Country Club Ln
- 37231 N Ganster Rd
- 2246 Alta Vista Dr
- 2708 Dana Ave
- 2705 Dana Ave
- 2817 N Pine St
- 2809 N Pine St
- 2805 N Pine St
- 2821 N Pine St
- 2810 N Pine St
- 2816 N Pine St
- 2804 N Pine St
- 2825 N Pine St
- 2820 N Pine St
- 2801 N Pine St
- 2800 N Pine St
- 2826 N Pine St
- 2809 N Butrick St
- 2833 N Pine St
- 2739 N Pine St
- 2805 N Butrick St
- 2813 N Butrick St
- 1410 Ferry St
- 2817 N Butrick St
- 2832 N Pine St