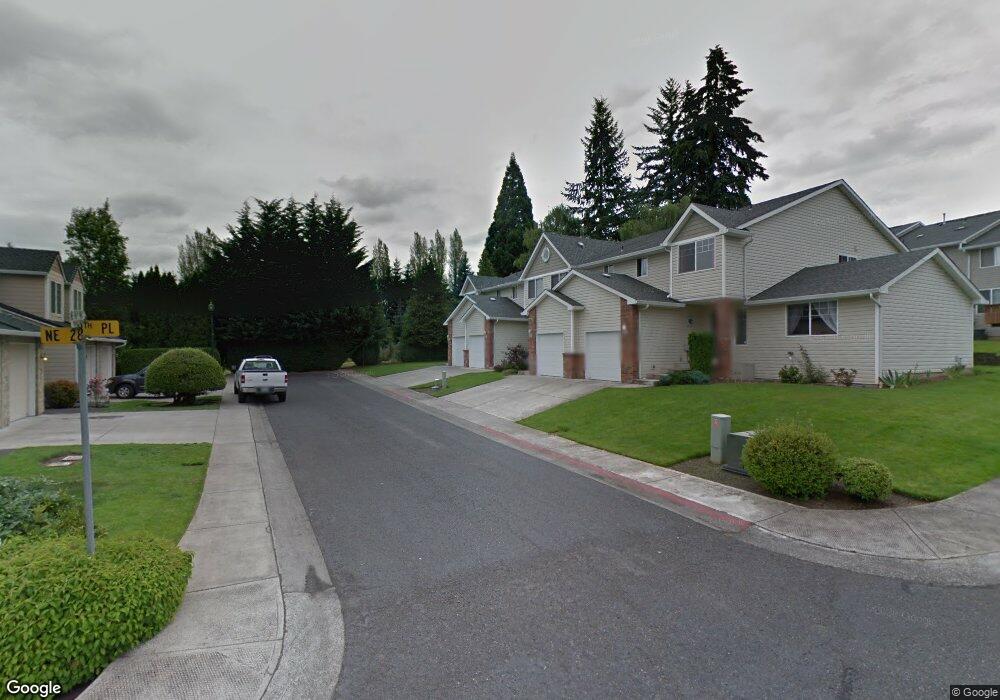
2813 NE 98th Way Vancouver, WA 98665
Northeast Hazel Dell NeighborhoodEstimated Value: $415,000 - $462,000
3
Beds
3
Baths
1,861
Sq Ft
$235/Sq Ft
Est. Value
About This Home
This home is located at 2813 NE 98th Way, Vancouver, WA 98665 and is currently estimated at $437,301, approximately $234 per square foot. 2813 NE 98th Way is a home located in Clark County with nearby schools including Sarah J. Anderson Elementary School, Gaiser Middle School, and Skyview High School.
Ownership History
Date
Name
Owned For
Owner Type
Purchase Details
Closed on
Jul 5, 2019
Sold by
Bigelow Living Trust
Bought by
Bigelow Scott A and Bigelow Tracey L Marks A
Current Estimated Value
Purchase Details
Closed on
Sep 7, 2005
Sold by
Knab Bessie Ann
Bought by
Bigelow Robert and Bigelow Living Trust
Home Financials for this Owner
Home Financials are based on the most recent Mortgage that was taken out on this home.
Original Mortgage
$112,900
Outstanding Balance
$60,060
Interest Rate
5.76%
Mortgage Type
Fannie Mae Freddie Mac
Estimated Equity
$377,241
Purchase Details
Closed on
May 24, 2005
Sold by
Grabda Wanda K and Koscinska Anna
Bought by
Knab Bessie Ann and Knab Family 1990 Trust
Purchase Details
Closed on
Jan 18, 2002
Sold by
Waterford Development Llc
Bought by
Grabda Wanda K and Koscinska Anna
Home Financials for this Owner
Home Financials are based on the most recent Mortgage that was taken out on this home.
Original Mortgage
$117,000
Interest Rate
7.11%
Create a Home Valuation Report for This Property
The Home Valuation Report is an in-depth analysis detailing your home's value as well as a comparison with similar homes in the area
Home Values in the Area
Average Home Value in this Area
Purchase History
| Date | Buyer | Sale Price | Title Company |
|---|---|---|---|
| Bigelow Scott A | -- | None Available | |
| Bigelow Robert | $212,900 | First American Title | |
| Knab Bessie Ann | $1,959,595 | First American Title | |
| Grabda Wanda K | $146,250 | First American Title Ins Co |
Source: Public Records
Mortgage History
| Date | Status | Borrower | Loan Amount |
|---|---|---|---|
| Open | Bigelow Robert | $112,900 | |
| Previous Owner | Grabda Wanda K | $117,000 |
Source: Public Records
Tax History Compared to Growth
Tax History
| Year | Tax Paid | Tax Assessment Tax Assessment Total Assessment is a certain percentage of the fair market value that is determined by local assessors to be the total taxable value of land and additions on the property. | Land | Improvement |
|---|---|---|---|---|
| 2025 | $3,729 | $401,417 | $162,800 | $238,617 |
| 2024 | $3,297 | $349,327 | $162,800 | $186,527 |
| 2023 | $3,621 | $356,269 | $161,000 | $195,269 |
| 2022 | $3,390 | $365,246 | $161,000 | $204,246 |
| 2021 | $3,069 | $304,429 | $119,000 | $185,429 |
| 2020 | $2,890 | $258,182 | $76,109 | $182,073 |
| 2019 | $2,819 | $258,277 | $73,260 | $185,017 |
| 2018 | $2,985 | $261,590 | $0 | $0 |
| 2017 | $2,623 | $231,691 | $0 | $0 |
| 2016 | $2,523 | $211,793 | $0 | $0 |
| 2015 | $2,523 | $190,383 | $0 | $0 |
| 2014 | -- | $183,856 | $0 | $0 |
| 2013 | -- | $158,540 | $0 | $0 |
Source: Public Records
Map
Nearby Homes
- 2812 NE 99th St
- 6712 NW 26th Ct
- 2506 NE 100th St
- 6717 NE 27th Place
- 3400 NE 97th St
- 2402 NE 96th St
- 2806 NE 105th Cir
- 2312 NE 104th St
- 8915 NE 28th Place
- 8914 NE 28th Place
- 3615 NE 102nd St
- 10619 NE 30th Ave
- 3217 NE 91st St
- 2002 NE 100th Cir
- 10805 NE 27th Ct
- 3300 NE 90th Cir
- 9408 NE 39th Ave
- 3801 NE 93rd St
- 10702 NE 37th Ct
- 1805 NE 94th St Unit 33
- 2811 NE 98th Way
- 2809 NE 98th Way
- 2807 NE 98th Way
- 2812 NE 97th Way
- 2814 NE 97th Way
- 2810 NE 97th Way
- 2808 NE 97th Way
- 2812 NE 98th Way
- 2810 NE 98th Way
- 2808 NE 98th Way
- 2806 NE 97th Way
- 2806 NE 98th Way
- 2804 NE 97th Way
- 9714 NE 28th Place
- 2813 NE 97th Way
- 2811 NE 97th Way
- 2815 NE 97th Way
- 2809 NE 97th Way
- 2807 NE 97th Way
- 9712 NE 28th Place