2813 Regner Rd McHenry, IL 60051
West Palm Beach NeighborhoodEstimated payment $4,153/month
Highlights
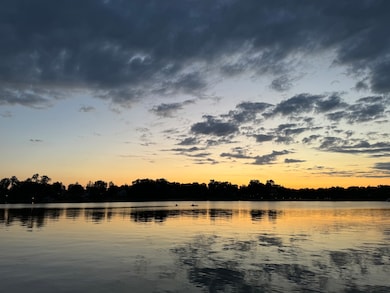
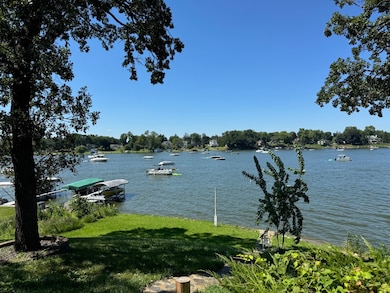
- Waterfront
- Living Room
- Central Air
- 2 Fireplaces
- Laundry Room
- Dining Room
About This Home
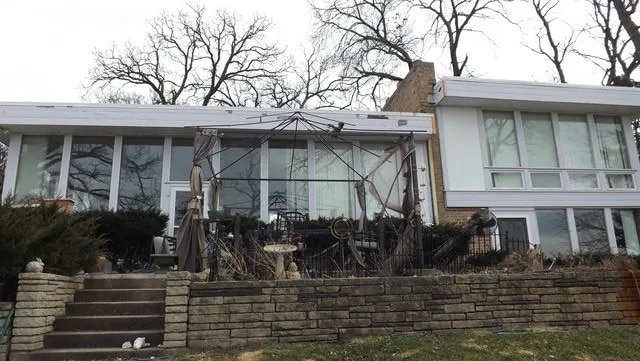
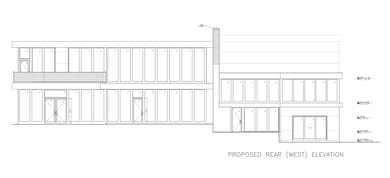
Calling all builders/developers Gutted property 2000sq ft , only steel structure to save. Architectural plans ready for extension to 8000sf. Double lot, 130 ft of lake front property on best part of Pistakee lake. Build your dream home! Pictures show drawing and visualization of proposed home. Drive by only! Call/email listing agent for details Broker related to owner.
Home Details
Home Type
- Single Family
Est. Annual Taxes
- $12,503
Year Built
- Built in 1964
Lot Details
- Lot Dimensions are 132x165
- Waterfront
Home Design
- Brick Exterior Construction
- Concrete Block And Stucco Construction
Interior Spaces
- 2,000 Sq Ft Home
- 2-Story Property
- 2 Fireplaces
- Family Room
- Living Room
- Dining Room
- Laundry Room
Bedrooms and Bathrooms
- 3 Bedrooms
- 3 Potential Bedrooms
- 2 Full Bathrooms
Finished Basement
- Partial Basement
- Finished Basement Bathroom
Parking
- 2 Parking Spaces
- Parking Available
Utilities
- Central Air
- Heating System Uses Natural Gas
- Well
- Septic Tank
Map
Home Values in the Area
Average Home Value in this Area
Tax History
| Year | Tax Paid | Tax Assessment Tax Assessment Total Assessment is a certain percentage of the fair market value that is determined by local assessors to be the total taxable value of land and additions on the property. | Land | Improvement |
|---|---|---|---|---|
| 2024 | $12,503 | $164,317 | $114,665 | $49,652 |
| 2023 | $20,336 | $241,159 | $102,728 | $138,431 |
| 2022 | $18,667 | $214,714 | $85,794 | $128,920 |
| 2021 | $17,802 | $199,958 | $79,898 | $120,060 |
| 2020 | $17,229 | $191,622 | $76,567 | $115,055 |
| 2019 | $16,986 | $181,960 | $72,706 | $109,254 |
| 2018 | $18,046 | $173,709 | $69,409 | $104,300 |
| 2017 | $17,375 | $163,030 | $65,142 | $97,888 |
| 2016 | $16,851 | $152,364 | $60,880 | $91,484 |
| 2013 | -- | $150,009 | $59,939 | $90,070 |
Property History
| Date | Event | Price | List to Sale | Price per Sq Ft |
|---|---|---|---|---|
| 11/09/2025 11/09/25 | Price Changed | $599,000 | -7.8% | $300 / Sq Ft |
| 10/09/2025 10/09/25 | For Sale | $650,000 | -- | $325 / Sq Ft |
Purchase History
| Date | Type | Sale Price | Title Company |
|---|---|---|---|
| Quit Claim Deed | -- | None Listed On Document | |
| Deed | $493,000 | None Listed On Document | |
| Warranty Deed | $500,000 | Ticor | |
| Warranty Deed | $289,000 | -- |
Mortgage History
| Date | Status | Loan Amount | Loan Type |
|---|---|---|---|
| Previous Owner | $391,500 | Unknown | |
| Previous Owner | $219,000 | No Value Available |
Source: Midwest Real Estate Data (MRED)
MLS Number: 12492264
APN: 10-20-126-024
Disclaimer: Certain information contained herein is derived from information provided by parties other than Homes.com. All information provided is deemed reliable, but is not guaranteed to be accurate and should be independently verified.
![]() Based on information submitted to the MLS GRID. All data is obtained from various sources and may not have been verified by broker or MLS GRID. Supplied Open House Information is subject to change without notice. All information should be independently reviewed and verified for accuracy. Properties may or may not be listed by the office/agent presenting the information. Some IDX listings have been excluded from this website.
Based on information submitted to the MLS GRID. All data is obtained from various sources and may not have been verified by broker or MLS GRID. Supplied Open House Information is subject to change without notice. All information should be independently reviewed and verified for accuracy. Properties may or may not be listed by the office/agent presenting the information. Some IDX listings have been excluded from this website.
The Digital Millennium Copyright Act of 1998, 17 U.S.C. § 512 (the “DMCA”) provides recourse for copyright owners who believe that material appearing on the Internet infringes their rights under U.S. copyright law. If you believe in good faith that any content or material made available in connection with our website or services infringes your copyright, you (or your agent) may send us a notice requesting that the content or material be removed, or access to it blocked.
Notices must be sent in writing by email to DMCAnotice@MLSGrid.com.
The DMCA requires that your notice of alleged copyright infringement include the following information:
(1) description of the copyrighted work that is the subject of claimed infringement;
(2) description of the alleged infringing content and information sufficient to permit us to locate the content;
(3) contact information for you, including your address, telephone number and email address;
(4) a statement by you that you have a good faith belief that the content in the manner complained of is not authorized by the copyright owner, or its agent, or by the operation of any law;
(5) a statement by you, signed under penalty of perjury, that the information in the notification is accurate and that you have the authority to enforce the copyrights that are claimed to be infringed; and
(6) a physical or electronic signature of the copyright owner or a person authorized to act on the copyright owner’s behalf. Failure to include all of the above information may result in the delay of the processing of your complaint.
- 1606 W August Ln
- 28986 W Manitoba Trail
- Lot 2 Pitzen Rd
- 3114 Chapel Hill Rd
- 3118 N Chapel Hill Rd
- 1614 River Terrace Dr
- 1304 River Terrace Dr
- 3321 N Bayview Ln
- Lot 1-5 N Lewis Ln
- 1801 Anthony Ln
- 520 Bald Knob Rd
- Lot 6&7 Pistakee View Dr
- 2916 Oakwood Ave
- 35116 N Lake Matthews Trail
- 1406 W Lincoln Rd
- 2303 Fairview Ave
- 35100 N Indian Trail
- 28448 W Big Hollow Rd
- 1811 Mason Corte Dr
- 1718 W Lincoln Rd
- 2712 Shorewood Dr Unit ID1305762P
- 2310 Truman Trail
- 525 Circle Dr Unit ID1374784P
- 32804 Bending Creek
- 4 N Pistakee Lake Rd
- 10 N Pistakee Lake Rd Unit ID1374789P
- 3415 Blake Blvd
- 3 Lilac Ave
- 45 Ernest Ave
- 2700 Hartigan Rd
- 3607 Johnsburg Rd
- 811 N River Rd Unit ID1306762P
- 406 Red Oak Cir
- 176 E Grand Ave Unit ID1374786P
- 115 Nippersink Blvd Unit 205
- 1941 N Orleans St
- 184 E Grand Ave Unit ID1374785P
- 450 Sullivan Lake Blvd
- 37648 N Lake Vista Terrace
- 3407 Venice Ave Unit ID1374787P
