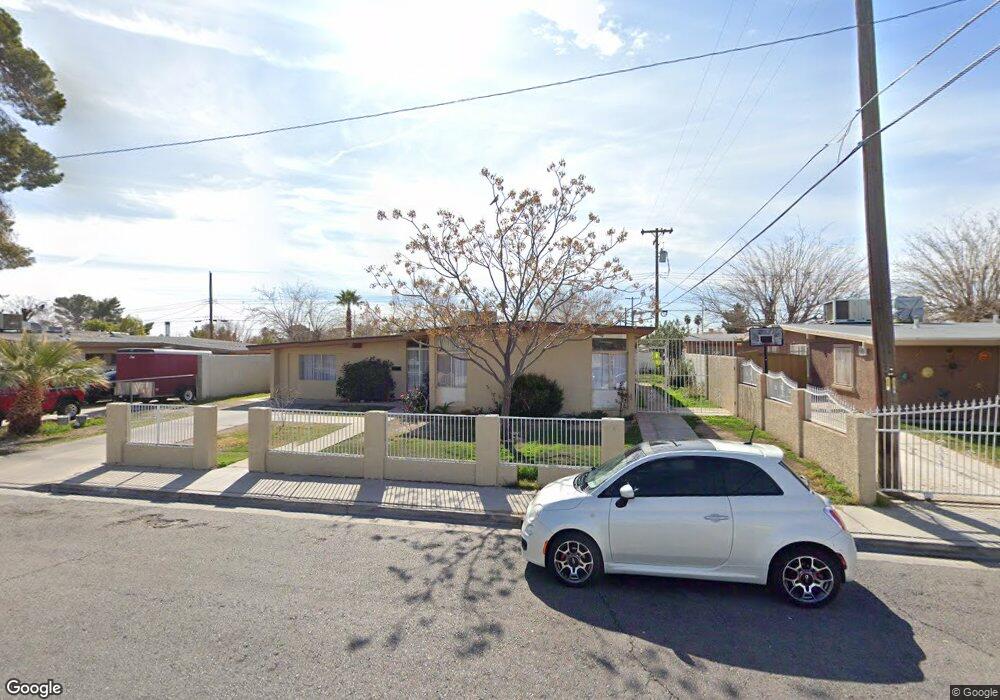
2813 Reynolds Ave North Las Vegas, NV 89030
Downtown North Las Vegas NeighborhoodEstimated Value: $320,736 - $378,000
4
Beds
3
Baths
1,713
Sq Ft
$198/Sq Ft
Est. Value
About This Home
This home is located at 2813 Reynolds Ave, North Las Vegas, NV 89030 and is currently estimated at $339,184, approximately $198 per square foot. 2813 Reynolds Ave is a home located in Clark County with nearby schools including Tom Williams Elementary School, J.D. Smith Middle School, and Rancho High School.
Ownership History
Date
Name
Owned For
Owner Type
Purchase Details
Closed on
Jul 29, 2006
Sold by
Soto Victor
Bought by
Ojeda Alejandro Alcaraz
Current Estimated Value
Purchase Details
Closed on
May 11, 2006
Sold by
Gomez Acosta Alfredo and Sanchez Yolanda
Bought by
Soto Victor
Purchase Details
Closed on
Apr 27, 2006
Sold by
Gomez Acosta Alfredo
Bought by
Soto Victor
Purchase Details
Closed on
Apr 21, 2003
Sold by
Leon Norma A
Bought by
Gomez Acosta Alfredo and Sanchez Yolanda
Home Financials for this Owner
Home Financials are based on the most recent Mortgage that was taken out on this home.
Original Mortgage
$113,981
Interest Rate
5.71%
Mortgage Type
FHA
Purchase Details
Closed on
Feb 19, 2002
Sold by
Gomez Alfredo Mercado and Gomez Rosenda
Bought by
Leon Norma A
Home Financials for this Owner
Home Financials are based on the most recent Mortgage that was taken out on this home.
Original Mortgage
$80,000
Interest Rate
7.13%
Create a Home Valuation Report for This Property
The Home Valuation Report is an in-depth analysis detailing your home's value as well as a comparison with similar homes in the area
Home Values in the Area
Average Home Value in this Area
Purchase History
| Date | Buyer | Sale Price | Title Company |
|---|---|---|---|
| Ojeda Alejandro Alcaraz | $99,203 | None Available | |
| Soto Victor | $114,000 | None Available | |
| Soto Victor | $114,000 | None Available | |
| Gomez Acosta Alfredo | $115,000 | United Title Of Nevada | |
| Leon Norma A | $100,000 | Stewart Title |
Source: Public Records
Mortgage History
| Date | Status | Borrower | Loan Amount |
|---|---|---|---|
| Previous Owner | Gomez Acosta Alfredo | $113,981 | |
| Previous Owner | Leon Norma A | $80,000 | |
| Closed | Leon Norma A | $20,000 |
Source: Public Records
Tax History Compared to Growth
Tax History
| Year | Tax Paid | Tax Assessment Tax Assessment Total Assessment is a certain percentage of the fair market value that is determined by local assessors to be the total taxable value of land and additions on the property. | Land | Improvement |
|---|---|---|---|---|
| 2025 | $789 | $46,505 | $24,150 | $22,355 |
| 2024 | $767 | $46,505 | $24,150 | $22,355 |
| 2023 | $587 | $46,059 | $25,900 | $20,159 |
| 2022 | $816 | $39,767 | $21,700 | $18,067 |
| 2021 | $756 | $37,151 | $20,300 | $16,851 |
| 2020 | $699 | $35,633 | $19,250 | $16,383 |
| 2019 | $655 | $31,583 | $15,750 | $15,833 |
| 2018 | $625 | $27,414 | $12,600 | $14,814 |
| 2017 | $844 | $25,149 | $10,500 | $14,649 |
| 2016 | $587 | $21,246 | $7,000 | $14,246 |
| 2015 | $584 | $19,420 | $5,600 | $13,820 |
| 2014 | $566 | $16,778 | $4,200 | $12,578 |
Source: Public Records
Map
Nearby Homes
- 2746 E Owens Ave
- 1736 Statz St
- 1720 Belmont St
- 1629 James St
- 2621 E Tonopah Ave
- 1311 Flower Ave
- 3220 Stanley Ave
- 2844 Hickey Ave
- 3200 E Owens Ave
- 2801 Emmons Ave
- 1912 Statz St
- 1413 N Mojave Rd
- 0 E Reynolds Ave
- 3204 Emmons Ave
- 1304 Melissa St
- 1620 Kenneth St
- 2315 Perliter Ave
- 1226 Coach Ln
- 2932 Demetrius Ave
- 3600 Reynolds Ave
- 2819 Reynolds Ave
- 2807 Reynolds Ave
- 2812 Stanley Ave
- 2818 Stanley Ave
- 2806 Stanley Ave
- 2825 Reynolds Ave
- 2801 Reynolds Ave
- 2812 Reynolds Ave
- 2824 Stanley Ave
- 2800 Stanley Ave
- 2818 Reynolds Ave
- 2831 Reynolds Ave
- 2747 Reynolds Ave
- 2824 Reynolds Ave
- 2800 Reynolds Ave
- 2830 Stanley Ave
- 2746 Stanley Ave
- 2830 Reynolds Ave
- 2813 Taylor Ave
- 2813 Stanley Ave