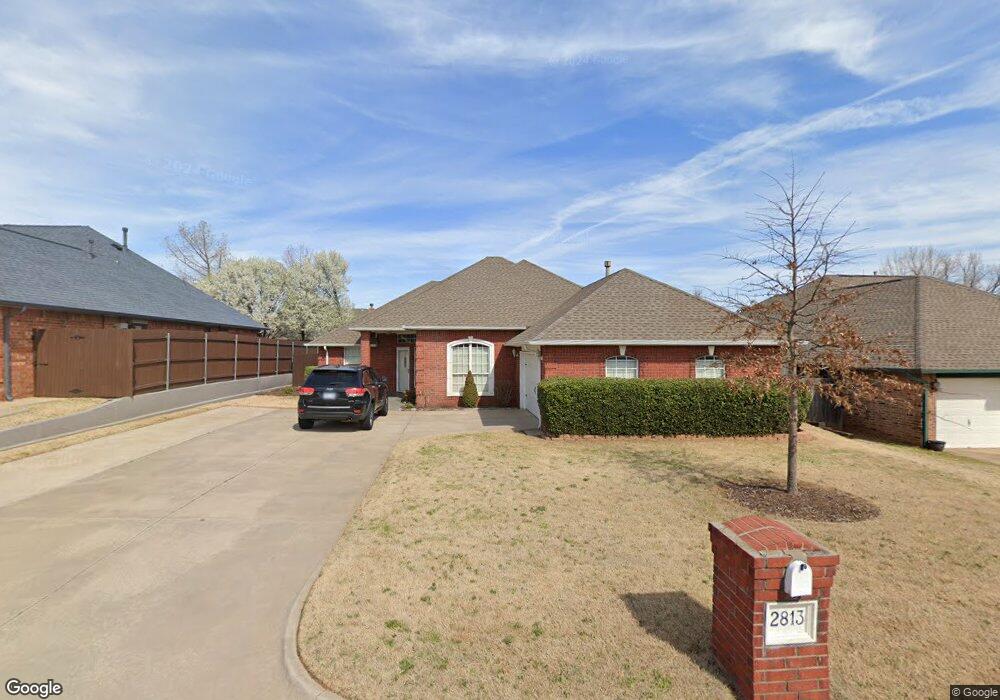
2813 SW 108th St Oklahoma City, OK 73170
Lakeridge Run NeighborhoodEstimated Value: $287,000 - $308,000
3
Beds
2
Baths
1,856
Sq Ft
$160/Sq Ft
Est. Value
About This Home
This home is located at 2813 SW 108th St, Oklahoma City, OK 73170 and is currently estimated at $297,457, approximately $160 per square foot. 2813 SW 108th St is a home located in Cleveland County with nearby schools including Fisher Elementary School, Brink Junior High School, and Westmoore High School.
Ownership History
Date
Name
Owned For
Owner Type
Purchase Details
Closed on
Apr 19, 2012
Sold by
Sherwood Kari
Bought by
Smith Bryan H
Current Estimated Value
Home Financials for this Owner
Home Financials are based on the most recent Mortgage that was taken out on this home.
Original Mortgage
$169,101
Outstanding Balance
$116,855
Interest Rate
3.92%
Mortgage Type
FHA
Estimated Equity
$180,602
Purchase Details
Closed on
May 17, 2011
Sold by
Phillips Kimbery
Bought by
Sherwood Kari
Home Financials for this Owner
Home Financials are based on the most recent Mortgage that was taken out on this home.
Original Mortgage
$158,185
Interest Rate
4.91%
Mortgage Type
FHA
Purchase Details
Closed on
Aug 24, 2005
Sold by
Petschel Richard E and Petschel Robin A
Bought by
Phillips Kimberly
Home Financials for this Owner
Home Financials are based on the most recent Mortgage that was taken out on this home.
Original Mortgage
$95,000
Interest Rate
5.61%
Mortgage Type
New Conventional
Create a Home Valuation Report for This Property
The Home Valuation Report is an in-depth analysis detailing your home's value as well as a comparison with similar homes in the area
Home Values in the Area
Average Home Value in this Area
Purchase History
| Date | Buyer | Sale Price | Title Company |
|---|---|---|---|
| Smith Bryan H | $173,500 | Stewart Abstract & Title Of | |
| Sherwood Kari | $162,500 | Stewart Abstract & Title Ok | |
| Phillips Kimberly | $138,000 | First American Title & Trust |
Source: Public Records
Mortgage History
| Date | Status | Borrower | Loan Amount |
|---|---|---|---|
| Open | Smith Bryan H | $169,101 | |
| Previous Owner | Sherwood Kari | $158,185 | |
| Previous Owner | Phillips Kimberly | $95,000 |
Source: Public Records
Tax History Compared to Growth
Tax History
| Year | Tax Paid | Tax Assessment Tax Assessment Total Assessment is a certain percentage of the fair market value that is determined by local assessors to be the total taxable value of land and additions on the property. | Land | Improvement |
|---|---|---|---|---|
| 2024 | $2,550 | $21,945 | $4,372 | $17,573 |
| 2023 | $2,482 | $21,306 | $3,670 | $17,636 |
| 2022 | $2,437 | $20,686 | $3,816 | $16,870 |
| 2021 | $2,358 | $20,083 | $4,478 | $15,605 |
| 2020 | $2,419 | $19,498 | $3,360 | $16,138 |
| 2019 | $2,446 | $19,498 | $3,360 | $16,138 |
| 2018 | $2,474 | $19,499 | $3,360 | $16,139 |
| 2017 | $2,479 | $19,499 | $0 | $0 |
| 2016 | $2,504 | $19,499 | $3,360 | $16,139 |
| 2015 | $2,289 | $19,301 | $3,326 | $15,975 |
| 2014 | $2,217 | $18,382 | $2,520 | $15,862 |
Source: Public Records
Map
Nearby Homes
- 2832 SW 108th St
- 11205 S Linn Ave
- 2613 SW 112th St
- 2705 SW 113th St
- 2608 SW 107th St
- 3105 SW 107th St
- 3100 SW 105th St
- 3112 SW 106th St
- 10321 Portsmouth Ct
- 10304 Lighthouse Ct
- 2821 SW 116th St
- 11104 Shoreside Dr
- 11433 Lakeridge Run
- 3116 SW 105th Terrace
- 11321 Fountain Blvd
- 11452 Lakeridge Run
- 11604 Gateshead Dr
- 2309 SW 105th Ct
- 10004 S Drexel Ave
- 10212 Jetty Ct
- 2809 SW 108th St
- 2817 SW 108th St
- 2808 SW 107th St
- 2805 SW 108th St
- 2821 SW 108th St
- 2812 SW 107th St
- 2804 SW 107th St
- 2816 SW 108th St
- 2812 SW 108th St
- 2808 SW 108th St
- 2816 SW 107th St
- 2801 SW 108th St
- 2800 SW 107th St
- 2804 SW 108th St
- 2825 SW 108th St
- 2820 SW 108th St
- 2820 SW 107th St
- 2800 SW 108th St
- 2824 SW 108th St
- 2805 SW 107th St