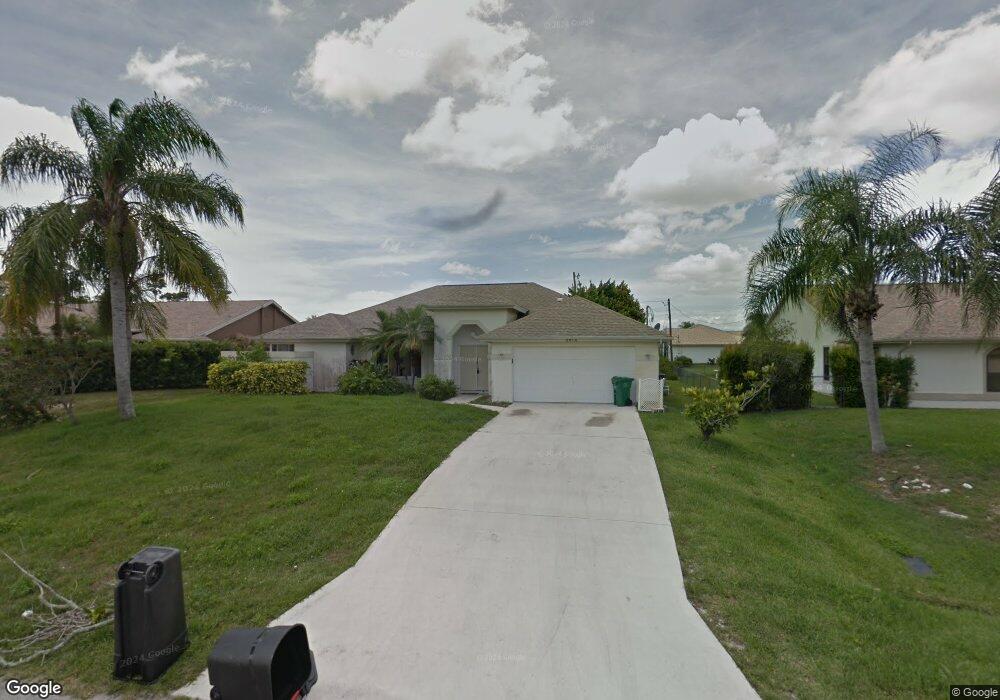
2814 SE Peru St Port Saint Lucie, FL 34984
Southbend Lakes NeighborhoodEstimated Value: $417,561 - $512,000
3
Beds
2
Baths
1,998
Sq Ft
$231/Sq Ft
Est. Value
About This Home
This home is located at 2814 SE Peru St, Port Saint Lucie, FL 34984 and is currently estimated at $461,640, approximately $231 per square foot. 2814 SE Peru St is a home located in St. Lucie County with nearby schools including Floresta Elementary School, Morningside Elementary School, and Mariposa Elementary School.
Ownership History
Date
Name
Owned For
Owner Type
Purchase Details
Closed on
Mar 21, 2007
Sold by
Wiesen Arthur M and Wiesen Sandra R
Bought by
Jackman Brent and Jackman Maryann R
Current Estimated Value
Home Financials for this Owner
Home Financials are based on the most recent Mortgage that was taken out on this home.
Original Mortgage
$206,250
Outstanding Balance
$124,908
Interest Rate
6.27%
Mortgage Type
Purchase Money Mortgage
Estimated Equity
$336,732
Purchase Details
Closed on
Jan 17, 2006
Sold by
Weisen Arthur M and Weisen Sandra R
Bought by
Wiesen Arthur M and Wiesen Sandra R
Purchase Details
Closed on
Apr 15, 2003
Sold by
Dunn Gerald T and Dunn Susan M
Bought by
Weisen Arthur M and Weisen Sandra R
Home Financials for this Owner
Home Financials are based on the most recent Mortgage that was taken out on this home.
Original Mortgage
$166,400
Interest Rate
5.62%
Mortgage Type
Purchase Money Mortgage
Create a Home Valuation Report for This Property
The Home Valuation Report is an in-depth analysis detailing your home's value as well as a comparison with similar homes in the area
Home Values in the Area
Average Home Value in this Area
Purchase History
| Date | Buyer | Sale Price | Title Company |
|---|---|---|---|
| Jackman Brent | $275,000 | Sunbelt Title Agency | |
| Wiesen Arthur M | -- | None Available | |
| Wiesen Arthur M | -- | None Available | |
| Weisen Arthur M | $208,000 | -- |
Source: Public Records
Mortgage History
| Date | Status | Borrower | Loan Amount |
|---|---|---|---|
| Open | Jackman Brent | $206,250 | |
| Previous Owner | Weisen Arthur M | $166,400 |
Source: Public Records
Tax History Compared to Growth
Tax History
| Year | Tax Paid | Tax Assessment Tax Assessment Total Assessment is a certain percentage of the fair market value that is determined by local assessors to be the total taxable value of land and additions on the property. | Land | Improvement |
|---|---|---|---|---|
| 2024 | $2,990 | $152,015 | -- | -- |
| 2023 | $2,990 | $147,588 | $0 | $0 |
| 2022 | $2,855 | $143,290 | $0 | $0 |
| 2021 | $2,765 | $139,117 | $0 | $0 |
| 2020 | $2,775 | $137,197 | $0 | $0 |
| 2019 | $2,744 | $134,113 | $0 | $0 |
| 2018 | $2,603 | $131,613 | $0 | $0 |
| 2017 | $2,640 | $181,100 | $34,000 | $147,100 |
| 2016 | $2,601 | $183,400 | $30,800 | $152,600 |
| 2015 | $2,624 | $151,400 | $20,800 | $130,600 |
| 2014 | $2,498 | $123,627 | $0 | $0 |
Source: Public Records
Map
Nearby Homes
- 2807 SE Peru St
- 2803 SE Peru St
- 2561 SE North Lookout Blvd
- 2805 SE Peru St
- 574 SE Nome Dr
- 576 SE Nome Dr
- 570 SE Nome Dr
- 545 SE Cliff Rd
- 454 SE Cork Rd
- 2861 SE South Lookout Blvd
- 2674 SE Erickson Dr
- 2801 SE Peru St
- 2610 SE Erickson Dr
- 2838 SE Eagle Dr
- 343 SE Fisk Rd
- 138 SE Fiore Bello
- 134 SE Fiore Bello
- 546 SE Nome Dr
- 184 SE Via Terra Bella
- 2720 SE Kern Rd
- 2800 SE Pace Dr
- 602 SE Daly Ct
- 2802 SE Pace Dr
- 2831 SE Peru St
- 606 SE Daly Ct
- 2833 SE Peru St
- 2829 SE Peru St
- 2804 SE Pace Dr
- 2835 SE Peru St
- 612 SE Daly Ct
- 2801 SE Pace Dr
- 2803 SE Pace Dr
- 2806 SE Pace Dr
- 2837 SE Peru St
- 2805 SE Pace Dr
- 2825 SE Peru St
- 2808 SE Pace Dr
- 608 SE Daly Ct
- 2839 SE Peru St
- 2807 SE Pace Dr