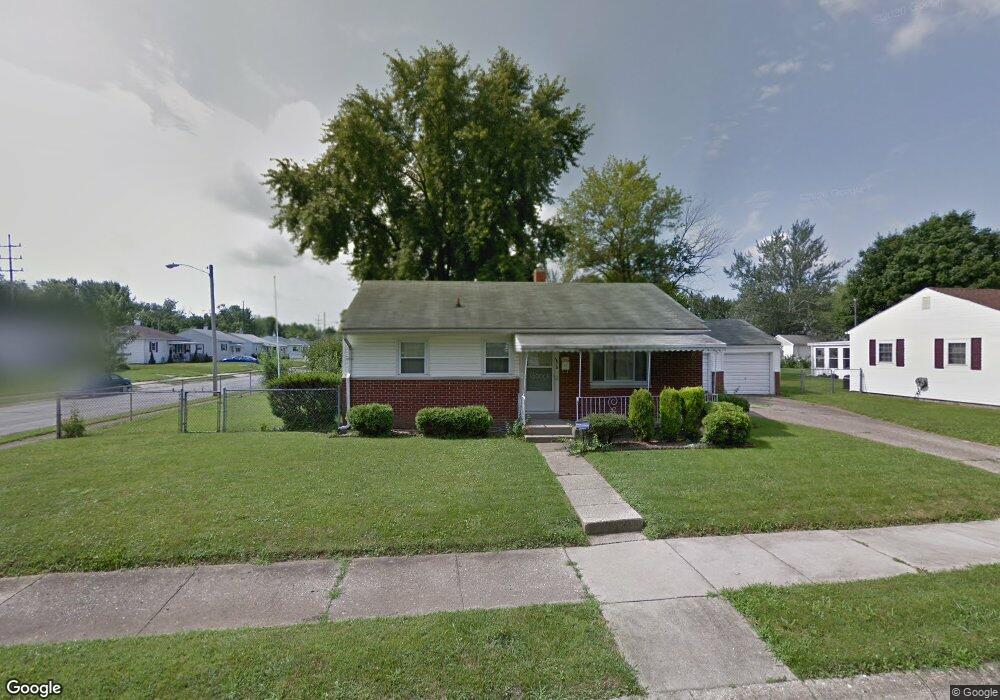
2815 Duncan St Springfield, OH 45505
Estimated Value: $129,301 - $156,000
3
Beds
1
Bath
816
Sq Ft
$177/Sq Ft
Est. Value
About This Home
This home is located at 2815 Duncan St, Springfield, OH 45505 and is currently estimated at $144,575, approximately $177 per square foot. 2815 Duncan St is a home located in Clark County with nearby schools including Mann Elementary School, Schaefer Middle School, and Springfield High School.
Ownership History
Date
Name
Owned For
Owner Type
Purchase Details
Closed on
Apr 10, 2014
Sold by
Lower Alan K and Lower Kathy
Bought by
Frank Carol A
Current Estimated Value
Home Financials for this Owner
Home Financials are based on the most recent Mortgage that was taken out on this home.
Original Mortgage
$56,745
Outstanding Balance
$42,872
Interest Rate
4.41%
Mortgage Type
New Conventional
Estimated Equity
$101,703
Purchase Details
Closed on
Feb 21, 2008
Sold by
Lower Dorothy
Bought by
Lower Alan K
Purchase Details
Closed on
Jan 16, 2001
Sold by
Lower Sue and Sue Sondra Sue
Bought by
Lower Sondra Sue and Lower Trust
Create a Home Valuation Report for This Property
The Home Valuation Report is an in-depth analysis detailing your home's value as well as a comparison with similar homes in the area
Home Values in the Area
Average Home Value in this Area
Purchase History
| Date | Buyer | Sale Price | Title Company |
|---|---|---|---|
| Frank Carol A | $58,500 | Ohio Real Estate Title | |
| Lower Alan K | -- | Attorney | |
| Lower Sondra Sue | -- | -- |
Source: Public Records
Mortgage History
| Date | Status | Borrower | Loan Amount |
|---|---|---|---|
| Open | Frank Carol A | $56,745 |
Source: Public Records
Tax History
| Year | Tax Paid | Tax Assessment Tax Assessment Total Assessment is a certain percentage of the fair market value that is determined by local assessors to be the total taxable value of land and additions on the property. | Land | Improvement |
|---|---|---|---|---|
| 2025 | $1,494 | $40,770 | $6,380 | $34,390 |
| 2024 | $1,455 | $30,190 | $5,970 | $24,220 |
| 2023 | $1,455 | $30,190 | $5,970 | $24,220 |
| 2022 | $1,490 | $30,190 | $5,970 | $24,220 |
| 2021 | $1,108 | $20,730 | $4,100 | $16,630 |
| 2020 | $1,111 | $20,730 | $4,100 | $16,630 |
| 2019 | $1,114 | $20,730 | $4,100 | $16,630 |
| 2018 | $1,155 | $20,650 | $3,420 | $17,230 |
| 2017 | $1,154 | $21,119 | $3,416 | $17,703 |
| 2016 | $1,156 | $21,119 | $3,416 | $17,703 |
| 2015 | $1,360 | $20,433 | $3,416 | $17,017 |
| 2014 | $1,387 | $20,433 | $3,416 | $17,017 |
| 2013 | $1,373 | $20,433 | $3,416 | $17,017 |
Source: Public Records
Map
Nearby Homes
- 1011 Mount Joy St
- 2809 Morton Dr
- 2804 Lowman St
- 451 Lawnview Ave
- 3012 E High St
- 3129 E High St
- 2338 Dellwood Dr
- 360 Buxton Ave
- 374 Raffensperger Ave
- 138 Lawnview Ave
- 2425 Kenilworth Ave
- 115 S Burnett Rd
- 2702 Maplewood Ave
- 2108 Sunset Ave
- 2111 Kenilworth Ave
- 250 S Douglas Ave Unit 254
- 1716 Salem Ave
- 1554 S Belmont Ave
- 129 N Burnett Rd
- 1714 Kenton St
Your Personal Tour Guide
Ask me questions while you tour the home.