Estimated Value: $112,000 - $115,183
2
Beds
2
Baths
1,050
Sq Ft
$109/Sq Ft
Est. Value
About This Home
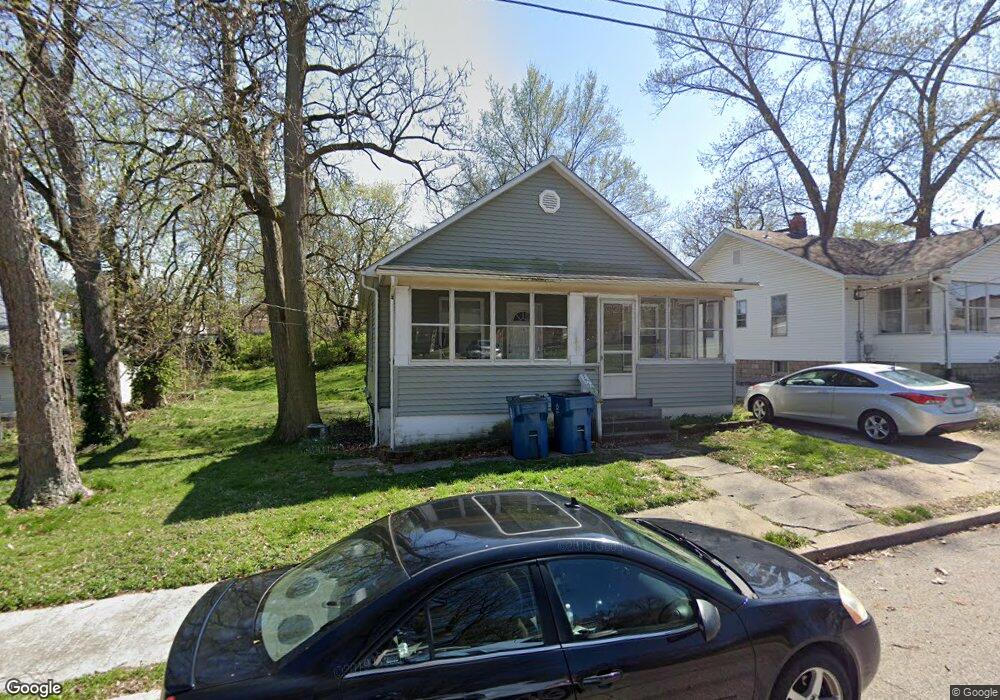
This home is located at 2815 Edwards St, Alton, IL 62002 and is currently estimated at $114,046, approximately $108 per square foot. 2815 Edwards St is a home located in Madison County with nearby schools including Lovejoy Elementary School, Alton Middle School, and Alton High School.
Ownership History
Date
Name
Owned For
Owner Type
Purchase Details
Closed on
Mar 21, 2011
Sold by
Regions Bank
Bought by
Trucks Ii Clyde A and Trucks Nancy K
Current Estimated Value
Home Financials for this Owner
Home Financials are based on the most recent Mortgage that was taken out on this home.
Original Mortgage
$17,350
Interest Rate
3.5%
Mortgage Type
Seller Take Back
Purchase Details
Closed on
Jun 4, 2009
Sold by
Rozny Amy M and Rozny Matthew
Bought by
Regions Bank
Purchase Details
Closed on
Jul 1, 2003
Sold by
Fruend Paul L and Fruend Diana L
Bought by
Rozny Matthew and Rozny Amy
Home Financials for this Owner
Home Financials are based on the most recent Mortgage that was taken out on this home.
Original Mortgage
$55,500
Interest Rate
6.5%
Mortgage Type
Purchase Money Mortgage
Create a Home Valuation Report for This Property
The Home Valuation Report is an in-depth analysis detailing your home's value as well as a comparison with similar homes in the area
Home Values in the Area
Average Home Value in this Area
Purchase History
We collect this data history from publicly available records. To have your information removed, we recommend requesting removal directly through your county’s website.
| Date | Buyer | Sale Price | Title Company |
|---|---|---|---|
| Trucks Ii Clyde A | $19,500 | Benedick Title Ins | |
| Regions Bank | $35,000 | None Available | |
| Rozny Matthew | $58,500 | Community Title & Escrow |
Source: Public Records
Mortgage History
We collect this data history from publicly available records. To have your information removed, we recommend requesting removal directly through your county’s website.
| Date | Status | Borrower | Loan Amount |
|---|---|---|---|
| Closed | Trucks Ii Clyde A | $17,350 | |
| Previous Owner | Rozny Matthew | $55,500 |
Source: Public Records
Tax History
| Year | Tax Paid | Tax Assessment Tax Assessment Total Assessment is a certain percentage of the fair market value that is determined by local assessors to be the total taxable value of land and additions on the property. | Land | Improvement |
|---|---|---|---|---|
| 2025 | $2,473 | $33,620 | $5,490 | $28,130 |
| 2024 | $2,473 | $30,420 | $4,970 | $25,450 |
| 2023 | $2,473 | $27,470 | $4,490 | $22,980 |
| 2022 | $2,324 | $24,830 | $4,060 | $20,770 |
| 2021 | $2,138 | $23,340 | $3,820 | $19,520 |
| 2020 | $2,088 | $22,500 | $3,680 | $18,820 |
| 2019 | $2,159 | $21,990 | $3,600 | $18,390 |
| 2018 | $2,102 | $21,420 | $3,510 | $17,910 |
| 2017 | $2,071 | $21,410 | $3,500 | $17,910 |
| 2016 | $2,030 | $21,410 | $3,500 | $17,910 |
| 2015 | $1,930 | $21,410 | $3,500 | $17,910 |
| 2014 | $1,930 | $21,410 | $3,500 | $17,910 |
| 2013 | $1,930 | $22,000 | $3,600 | $18,400 |
Source: Public Records
Map
Nearby Homes
- 2801 Brown St
- 2705 College Ave
- 3024 Brown St
- 3025 Leverett St
- 3027 Mayfield Ave
- 1205 Florence St
- 0 Washington Ave
- 1320 Washington Ave
- 1220 Main St
- 2717 Judson Ave
- 3210 Leverett Ct
- 2315 Brown St
- 3034 Glenwood Ave
- 1915 Clawson St
- 1000 Willard Ave
- 3201 Edgewood Ave
- 3302 College Ave
- 2814 Grandview Ave
- 3410 Fullerton Ave
- 13 Hebner Dr
- 2805 Edwards St
- 1526 Spaulding St
- 1524 Spaulding St
- 1529 Seminary St
- 1522 Spaulding St
- 2820 Edwards St
- 1520 Spaulding St
- 2824 Edwards St
- 1515 Seminary St
- 2802 Edwards St
- 2814 Edwards St
- 1505 Seminary St
- 1610 Shurtleff Ct
- 2808 Brown St
- 2814 Brown St
- 2721 Edwards St
- 2820 Brown St
- 2804 Brown St
- 1615 Seminary St
- 2800 Brown St
Your Personal Tour Guide
Ask me questions while you tour the home.