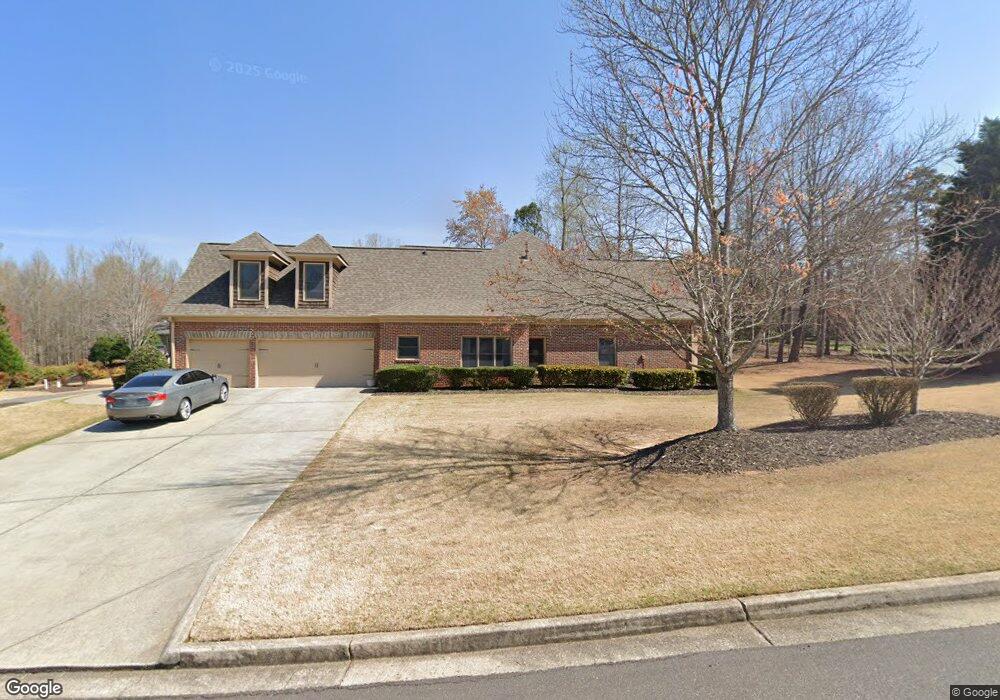
2815 Hickory Common Ct Cumming, GA 30028
Estimated Value: $712,000 - $808,000
4
Beds
3
Baths
2,944
Sq Ft
$252/Sq Ft
Est. Value
About This Home
This home is located at 2815 Hickory Common Ct, Cumming, GA 30028 and is currently estimated at $741,105, approximately $251 per square foot. 2815 Hickory Common Ct is a home located in Forsyth County with nearby schools including Poole's Mill Elementary School, Liberty Middle School, and West Forsyth High School.
Ownership History
Date
Name
Owned For
Owner Type
Purchase Details
Closed on
Jan 19, 2021
Sold by
Hudson William R
Bought by
Baldwin Jeffrey A and Baldwin Cheryl L
Current Estimated Value
Home Financials for this Owner
Home Financials are based on the most recent Mortgage that was taken out on this home.
Original Mortgage
$382,500
Outstanding Balance
$340,719
Interest Rate
2.6%
Mortgage Type
New Conventional
Estimated Equity
$400,386
Purchase Details
Closed on
Aug 15, 2008
Sold by
Northridge Homes Llc
Bought by
Hudson William R and Hudson Nora B
Purchase Details
Closed on
Jul 9, 2007
Sold by
Pinebrook Communities Llc
Bought by
Northbridge Homes Llc
Home Financials for this Owner
Home Financials are based on the most recent Mortgage that was taken out on this home.
Original Mortgage
$684,000
Interest Rate
6.37%
Create a Home Valuation Report for This Property
The Home Valuation Report is an in-depth analysis detailing your home's value as well as a comparison with similar homes in the area
Home Values in the Area
Average Home Value in this Area
Purchase History
| Date | Buyer | Sale Price | Title Company |
|---|---|---|---|
| Baldwin Jeffrey A | $450,000 | -- | |
| Hudson William R | $363,500 | -- | |
| Northbridge Homes Llc | $190,000 | -- |
Source: Public Records
Mortgage History
| Date | Status | Borrower | Loan Amount |
|---|---|---|---|
| Open | Baldwin Jeffrey A | $382,500 | |
| Previous Owner | Northbridge Homes Llc | $684,000 |
Source: Public Records
Tax History Compared to Growth
Tax History
| Year | Tax Paid | Tax Assessment Tax Assessment Total Assessment is a certain percentage of the fair market value that is determined by local assessors to be the total taxable value of land and additions on the property. | Land | Improvement |
|---|---|---|---|---|
| 2025 | $1,403 | $258,248 | $62,000 | $196,248 |
| 2024 | $1,403 | $232,036 | $54,000 | $178,036 |
| 2023 | $1,302 | $237,496 | $52,000 | $185,496 |
| 2022 | $5,214 | $181,248 | $36,000 | $145,248 |
| 2021 | $5,005 | $181,248 | $36,000 | $145,248 |
| 2020 | $1,083 | $148,308 | $22,000 | $126,308 |
| 2019 | $1,089 | $148,328 | $22,000 | $126,328 |
| 2018 | $993 | $131,748 | $22,000 | $109,748 |
| 2017 | $1,034 | $135,212 | $22,000 | $113,212 |
| 2016 | $1,034 | $135,212 | $22,000 | $113,212 |
| 2015 | $1,034 | $135,212 | $22,000 | $113,212 |
| 2014 | $974 | $134,356 | $0 | $0 |
Source: Public Records
Map
Nearby Homes
- 2850 Willow Bend Dr
- 3330 Carswell Bend
- 0 Bethelview Rd Unit 10600103
- 0 Bethelview Rd Unit 7645827
- 0 Bethelview Rd Unit 7598310
- 0 Bethelview Rd Unit 7130265
- 0 Bethelview Rd Unit 10102046
- 3220 Carswell Bend
- 3505 Watson Rd
- 2840 Bryant Ct
- 3525 Montebello Pkwy
- 4015 Fouts Dr
- 2795 Roper Rd
- 3970 Fouts Dr
- 3735 Westhaven Dr
- 3705 Westhaven Dr
- 3735 Hazel Ave
- 4440 Aaronmoor Ln
- 2610 Misty Hollow Ln
- 2775 Marie Way
- 2815 Hickory Commons Ct
- 2735 Willow Bend Dr
- 2830 Hickory Common Ct
- 2835 Hickory Common Ct
- 2820 Hickory Common Ct
- 2740 Willow Bend Dr
- 2830 Hickory Commons Ct
- 2750 Willow Bend Dr
- 2730 Willow Bend Dr
- 2820 Hickory Commons Ct
- 2810 Willow Bend Dr
- 2685 Willow Bend Dr
- 2720 Willow Bend Dr
- 2675 Willow Bend Dr
- 2675 Willow Bend Dr Unit 34
- 2840 Willow Bend Dr
- 2665 Willow Bend Dr
- 2815 Willow Bend Dr
- 0 Willow Bend Dr Unit 8225566
- 0 Willow Bend Dr Unit 8445819