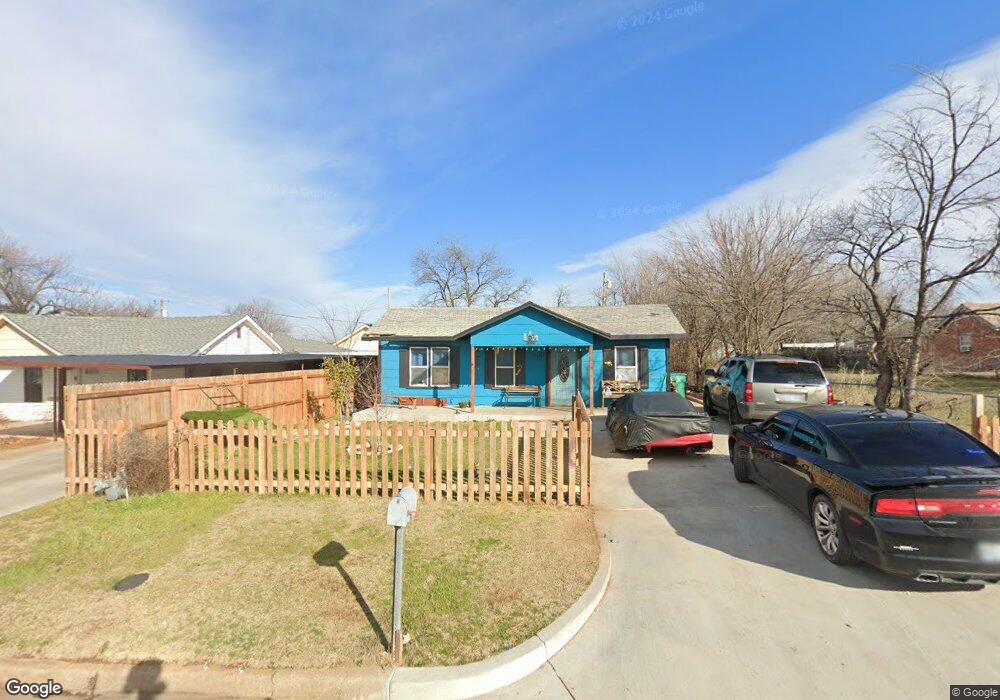
2815 SW 35th St Oklahoma City, OK 73119
Jackson NeighborhoodEstimated Value: $61,000 - $73,504
2
Beds
1
Bath
570
Sq Ft
$115/Sq Ft
Est. Value
About This Home
This home is located at 2815 SW 35th St, Oklahoma City, OK 73119 and is currently estimated at $65,626, approximately $115 per square foot. 2815 SW 35th St is a home located in Oklahoma County with nearby schools including Van Buren Elementary School, Mary Golda Ross Middle School, and Northwest Classen High School.
Ownership History
Date
Name
Owned For
Owner Type
Purchase Details
Closed on
May 31, 2023
Sold by
Gonzalez Nolberta
Bought by
Perez Francisco Javier Atila and Ambriz Marisol Atilano
Current Estimated Value
Purchase Details
Closed on
Dec 30, 2010
Sold by
Secretary Of Housing & Urban Development
Bought by
Gonzalez Nolberta
Purchase Details
Closed on
May 11, 2010
Sold by
Covarrubias Vanessa H
Bought by
Secretary Of Housing & Urban Development
Purchase Details
Closed on
Aug 18, 2005
Sold by
Munoz Flavio
Bought by
Covarrubias Vanessa H and Herrera Maria
Purchase Details
Closed on
Sep 28, 2004
Sold by
Lara Carmaletta Christine and Cohenour Cynthia
Bought by
Munoz Flavio
Purchase Details
Closed on
Feb 26, 2002
Sold by
Cherry Frankie L and Cherry Shirley F
Bought by
Lara Carmaletta Christine and Cohenour Cynthia
Purchase Details
Closed on
Oct 8, 1999
Sold by
Olson Keith A
Bought by
Cherry Frankie L and Cherry Shirley F
Create a Home Valuation Report for This Property
The Home Valuation Report is an in-depth analysis detailing your home's value as well as a comparison with similar homes in the area
Home Values in the Area
Average Home Value in this Area
Purchase History
| Date | Buyer | Sale Price | Title Company |
|---|---|---|---|
| Perez Francisco Javier Atila | -- | None Listed On Document | |
| Gonzalez Nolberta | -- | Heartland Title & Closing Ll | |
| Secretary Of Housing & Urban Development | -- | First American Title | |
| Covarrubias Vanessa H | $30,000 | Stewart Abstract & Title Of | |
| Munoz Flavio | $27,000 | Stewart Escrow & Title | |
| Lara Carmaletta Christine | -- | -- | |
| Cherry Frankie L | $18,000 | -- |
Source: Public Records
Tax History Compared to Growth
Tax History
| Year | Tax Paid | Tax Assessment Tax Assessment Total Assessment is a certain percentage of the fair market value that is determined by local assessors to be the total taxable value of land and additions on the property. | Land | Improvement |
|---|---|---|---|---|
| 2024 | $414 | $3,676 | $706 | $2,970 |
| 2023 | $414 | $3,500 | $747 | $2,753 |
| 2022 | $376 | $3,334 | $833 | $2,501 |
| 2021 | $357 | $3,176 | $668 | $2,508 |
| 2020 | $343 | $3,025 | $775 | $2,250 |
| 2019 | $366 | $3,245 | $775 | $2,470 |
| 2018 | $355 | $3,136 | $0 | $0 |
| 2017 | $342 | $3,024 | $1,163 | $1,861 |
| 2016 | $342 | $3,024 | $1,163 | $1,861 |
| 2015 | $374 | $3,275 | $1,163 | $2,112 |
| 2014 | $365 | $3,212 | $1,163 | $2,049 |
Source: Public Records
Map
Nearby Homes
- 2819 SW 33rd St
- 2815 SW 32nd St
- 2824 SW 31st St
- 2912 SW 39th Terrace
- 3013 SW 40th Place
- 2850 SW 40th St
- 2539 SW 32nd St
- 2504 SW 35th St
- 2644 SW 40th St
- 4021 S Drexel Ave
- 4200 SW 29th St
- 3928 S Agnew Place
- 2625 SW 43rd St
- 2617 SW 43rd St
- 3236 SW 38th St
- 3325 S Independence Ave
- 3616 S Parkview Ave
- 3001 SW 26th St
- 3916 S Youngs Place
- 2304 SW Binkley St
- 2817 SW 35th St
- 2805 SW 35th St
- 2821 SW 35th St
- 2814 SW 34th St
- 2801 SW 35th St
- 2810 SW 34th St
- 2816 SW 34th St
- 2808 SW 34th St
- 2824 SW 34th St
- 2831 SW 35th St
- 2800 SW 34th St
- 2814 SW 35th St
- 2828 SW 34th St
- 2804 SW 35th St
- 2818 SW 35th St
- 2832 SW 34th St
- 2800 SW 35th St
- 2828 SW 35th St
- 2744 SW 34th St
- 2845 SW 35th St