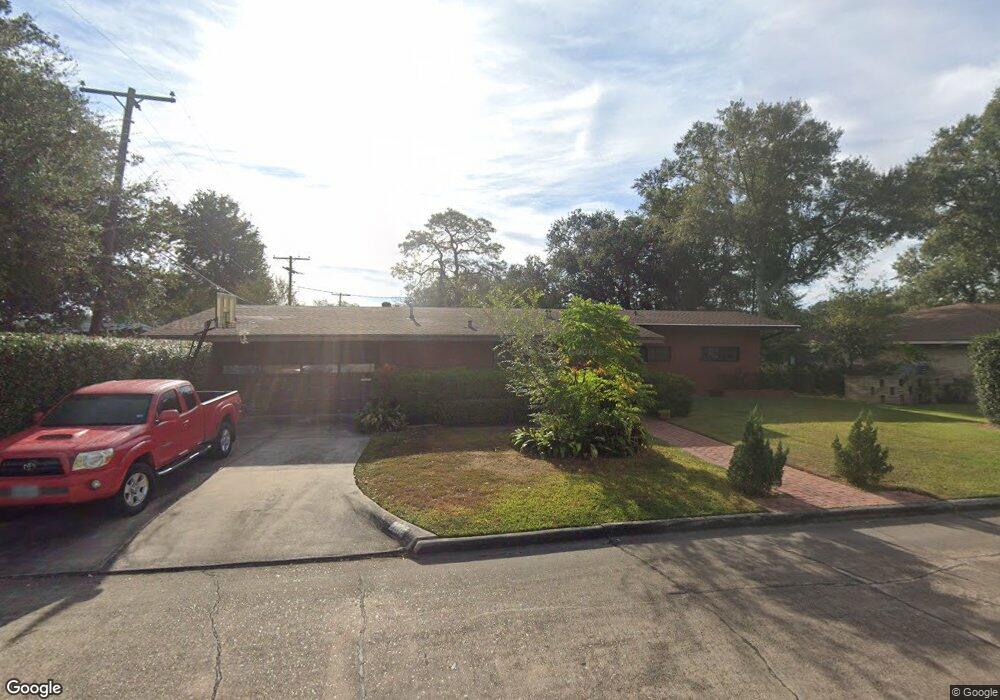
2816 35th St Port Arthur, TX 77640
Estimated Value: $197,563 - $253,000
--
Bed
--
Bath
2,184
Sq Ft
$99/Sq Ft
Est. Value
About This Home
This home is located at 2816 35th St, Port Arthur, TX 77640 and is currently estimated at $215,391, approximately $98 per square foot. 2816 35th St is a home located in Jefferson County with nearby schools including Houston Elementary School, Abraham Lincoln Middle School, and Memorial High School.
Ownership History
Date
Name
Owned For
Owner Type
Purchase Details
Closed on
Jan 31, 2006
Sold by
Davis Bruce A and Davis Beatrice K
Bought by
Raymond Denard C and Raymond Misty
Current Estimated Value
Home Financials for this Owner
Home Financials are based on the most recent Mortgage that was taken out on this home.
Original Mortgage
$77,900
Outstanding Balance
$43,958
Interest Rate
6.24%
Mortgage Type
Fannie Mae Freddie Mac
Estimated Equity
$171,433
Purchase Details
Closed on
Jun 25, 2004
Sold by
Davis Beatrice K
Bought by
Davis Bruce A and Davis Beatrice K
Create a Home Valuation Report for This Property
The Home Valuation Report is an in-depth analysis detailing your home's value as well as a comparison with similar homes in the area
Home Values in the Area
Average Home Value in this Area
Purchase History
| Date | Buyer | Sale Price | Title Company |
|---|---|---|---|
| Raymond Denard C | -- | None Available | |
| Davis Bruce A | -- | -- |
Source: Public Records
Mortgage History
| Date | Status | Borrower | Loan Amount |
|---|---|---|---|
| Open | Raymond Denard C | $77,900 |
Source: Public Records
Tax History Compared to Growth
Tax History
| Year | Tax Paid | Tax Assessment Tax Assessment Total Assessment is a certain percentage of the fair market value that is determined by local assessors to be the total taxable value of land and additions on the property. | Land | Improvement |
|---|---|---|---|---|
| 2025 | $4,361 | $224,594 | $10,800 | $213,794 |
| 2024 | $4,361 | $222,254 | $8,460 | $213,794 |
| 2023 | $4,361 | $202,818 | $8,460 | $194,358 |
| 2022 | $6,236 | $196,339 | $8,460 | $187,879 |
| 2021 | $7,066 | $213,212 | $8,460 | $204,752 |
| 2020 | $2,796 | $84,351 | $8,460 | $75,891 |
| 2019 | $2,461 | $77,220 | $8,460 | $68,760 |
| 2018 | $1,325 | $41,560 | $8,460 | $33,100 |
| 2017 | $2,393 | $77,220 | $8,460 | $68,760 |
| 2016 | $2,262 | $77,220 | $8,460 | $68,760 |
| 2015 | $2,184 | $73,170 | $8,460 | $64,710 |
| 2014 | $2,184 | $73,170 | $8,460 | $64,710 |
Source: Public Records
Map
Nearby Homes