Estimated Value: $416,000 - $480,000
--
Bed
4
Baths
3,099
Sq Ft
$142/Sq Ft
Est. Value
About This Home
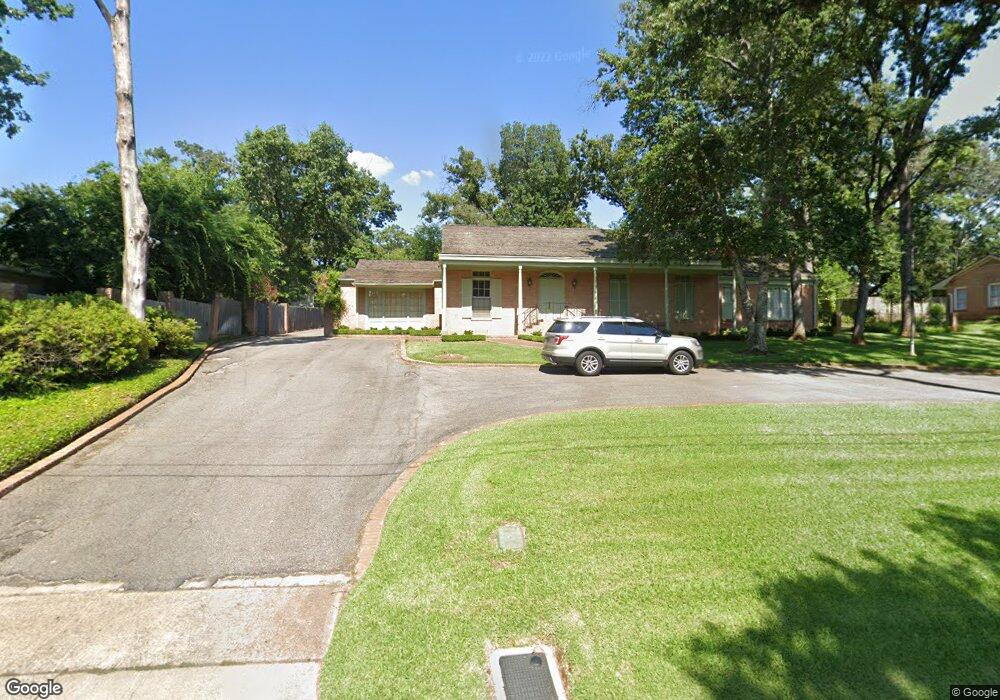
This home is located at 2816 Fry Ave, Tyler, TX 75701 and is currently estimated at $441,435, approximately $142 per square foot. 2816 Fry Ave is a home located in Smith County with nearby schools including Woods Elementary School, Hubbard Middle School, and Tyler Legacy High School.
Ownership History
Date
Name
Owned For
Owner Type
Purchase Details
Closed on
Sep 1, 2025
Sold by
Simons Sara S
Bought by
Sara Simons Molinari Trust and Molinari
Current Estimated Value
Purchase Details
Closed on
Dec 12, 2005
Sold by
Simons Sara S and Estate Of Watson T Simons
Bought by
Simons Sara S
Create a Home Valuation Report for This Property
The Home Valuation Report is an in-depth analysis detailing your home's value as well as a comparison with similar homes in the area
Home Values in the Area
Average Home Value in this Area
Purchase History
| Date | Buyer | Sale Price | Title Company |
|---|---|---|---|
| Sara Simons Molinari Trust | -- | None Listed On Document | |
| Simons Sara S | -- | None Available | |
| Simons Sara S | -- | None Available |
Source: Public Records
Tax History Compared to Growth
Tax History
| Year | Tax Paid | Tax Assessment Tax Assessment Total Assessment is a certain percentage of the fair market value that is determined by local assessors to be the total taxable value of land and additions on the property. | Land | Improvement |
|---|---|---|---|---|
| 2025 | $941 | $417,496 | $75,838 | $341,658 |
| 2024 | $941 | $351,944 | $82,574 | $369,519 |
| 2023 | $5,577 | $436,547 | $82,574 | $353,973 |
| 2022 | $5,698 | $342,924 | $68,811 | $274,113 |
| 2021 | $5,548 | $264,421 | $68,811 | $195,610 |
| 2020 | $5,885 | $275,013 | $68,811 | $206,202 |
| 2019 | $5,546 | $253,630 | $55,049 | $198,581 |
| 2018 | $5,151 | $245,247 | $55,049 | $190,198 |
| 2017 | $4,597 | $245,247 | $55,049 | $190,198 |
| 2016 | $4,179 | $195,742 | $55,049 | $140,693 |
| 2015 | $1,825 | $195,620 | $55,049 | $140,571 |
| 2014 | $1,825 | $190,921 | $55,049 | $135,872 |
Source: Public Records
Map
Nearby Homes
- 905 E Watkins St
- 904 E Dulse St
- 1024 Clyde Dr
- 1101 Clyde Dr
- 3006 de Charles St
- 1102 S Peach Ave S
- 515 & 517 Charnwood St
- 3922 & 3928 McDonald Rd
- 611 E Watkins St
- 1018 Pollard Dr
- 2521 Pounds Ave
- 3200 Decharles St
- 1113 E Amherst Dr
- 2431 Homestead Ln
- 3008 Oak Knob Dr
- 2438 Dietz Ln
- 2425 Dietz Ln
- 2918 Oak Knob St
- 2820 Oak Knob St
- 3110 Curtis Dr
- 2802 Fry Ave
- 2828 Fry Ave
- 2819 Pounds Ave
- 2817 Fry Ave
- 2803 Pounds Ave
- 1018 E Watkins St
- 1018 1018 Watkins
- 919 919 Dulse
- 919 E Dulse St
- 918 E Watkins St
- 1015 1015 E Watkins St
- 1015 1015 Watkins
- 1002 E Dulse St
- 1015 E Watkins St
- 2816 S Keaton Ave
- 1004 E Dulse St
- 904 904 E Watkins
- 919 919 E Watkins
- 2806 S Keaton Ave
- 2818 Pounds Ave