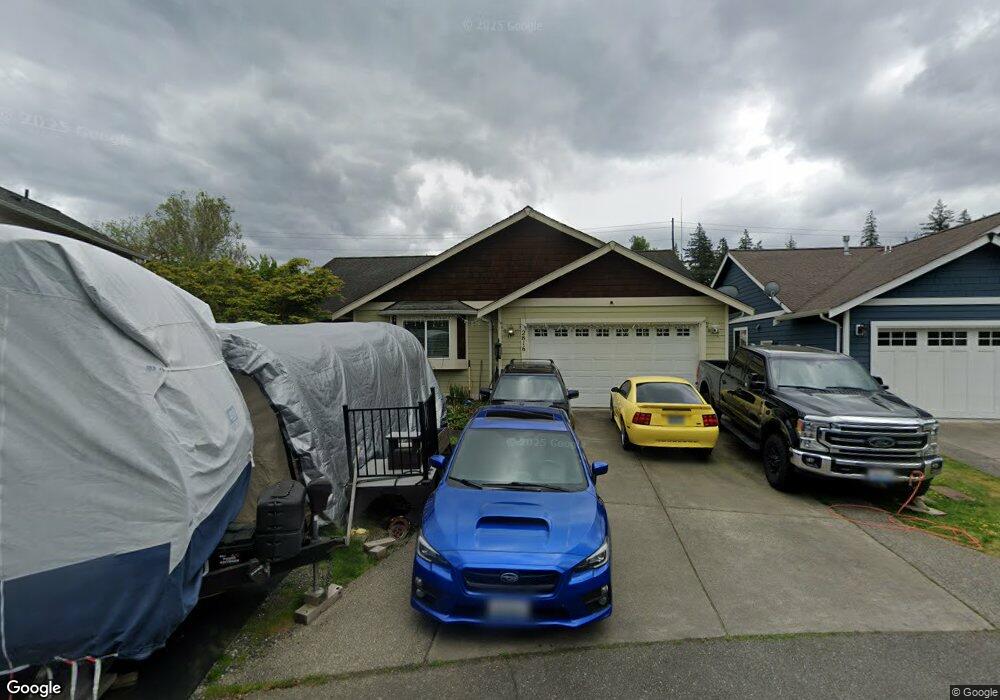
2816 Lindshier Ave Bellingham, WA 98226
Barkley NeighborhoodEstimated Value: $540,000 - $737,000
3
Beds
2
Baths
1,669
Sq Ft
$400/Sq Ft
Est. Value
About This Home
This home is located at 2816 Lindshier Ave, Bellingham, WA 98226 and is currently estimated at $666,842, approximately $399 per square foot. 2816 Lindshier Ave is a home located in Whatcom County with nearby schools including Northern Heights Elementary School, Shuksan Middle School, and Squalicum High School.
Ownership History
Date
Name
Owned For
Owner Type
Purchase Details
Closed on
May 11, 2020
Sold by
Williams Eli W
Bought by
Williams Eli W and Williams Kimberly R
Current Estimated Value
Home Financials for this Owner
Home Financials are based on the most recent Mortgage that was taken out on this home.
Original Mortgage
$283,343
Outstanding Balance
$247,877
Interest Rate
3%
Mortgage Type
FHA
Estimated Equity
$418,965
Purchase Details
Closed on
Aug 29, 2005
Sold by
Tembe Llc
Bought by
Williams Eli W and Williams Shoko A
Home Financials for this Owner
Home Financials are based on the most recent Mortgage that was taken out on this home.
Original Mortgage
$59,900
Interest Rate
5.64%
Mortgage Type
Credit Line Revolving
Purchase Details
Closed on
Feb 7, 2005
Sold by
Geyer Ruth M
Bought by
Tembe Llc
Purchase Details
Closed on
Jul 30, 2003
Sold by
Mendenhall Perry A and Mendenhall Carolyn J
Bought by
Geyer Ruth M
Purchase Details
Closed on
Jul 25, 2003
Sold by
Geyer William T
Bought by
Geyer Ruth M
Create a Home Valuation Report for This Property
The Home Valuation Report is an in-depth analysis detailing your home's value as well as a comparison with similar homes in the area
Home Values in the Area
Average Home Value in this Area
Purchase History
| Date | Buyer | Sale Price | Title Company |
|---|---|---|---|
| Williams Eli W | -- | None Available | |
| Williams Eli W | $299,780 | Chicago Title Insurance | |
| Tembe Llc | -- | Stewart Title Company | |
| Geyer Ruth M | -- | Stewart Title Company | |
| Geyer Ruth M | -- | Stewart Title Company |
Source: Public Records
Mortgage History
| Date | Status | Borrower | Loan Amount |
|---|---|---|---|
| Open | Williams Eli W | $283,343 | |
| Closed | Williams Eli W | $59,900 | |
| Closed | Williams Eli W | $239,600 |
Source: Public Records
Tax History Compared to Growth
Tax History
| Year | Tax Paid | Tax Assessment Tax Assessment Total Assessment is a certain percentage of the fair market value that is determined by local assessors to be the total taxable value of land and additions on the property. | Land | Improvement |
|---|---|---|---|---|
| 2024 | $4,740 | $583,328 | $198,195 | $385,133 |
| 2023 | $4,740 | $608,978 | $206,910 | $402,068 |
| 2022 | $4,101 | $534,191 | $181,500 | $352,691 |
| 2021 | $4,153 | $441,480 | $150,000 | $291,480 |
| 2020 | $4,014 | $421,941 | $132,405 | $289,536 |
| 2019 | $3,591 | $394,212 | $123,803 | $270,409 |
| 2018 | $3,716 | $353,581 | $111,053 | $242,528 |
| 2017 | $3,231 | $312,852 | $98,260 | $214,592 |
| 2016 | $2,957 | $284,309 | $89,420 | $194,889 |
| 2015 | $2,755 | $270,874 | $85,000 | $185,874 |
| 2014 | -- | $244,136 | $72,240 | $171,896 |
| 2013 | -- | $233,672 | $70,000 | $163,672 |
Source: Public Records
Map
Nearby Homes
- 2809 E Sunset Dr
- 3010 E Sunset Dr
- 3001 E Sunset Dr
- 2413 E Sunset Dr
- 3651 Sussex Dr
- 3649 Sussex Dr
- 3527 Sussex Dr
- 3709 Bristol St
- 3713 Bristol St
- 3403 Sussex Dr
- 3428 Sussex Dr
- 3561 Skylark Loop
- 0 E Bakerview Rd Unit NWM2398341
- 3276 Spyglass Dr
- 3159 Chandler Pkwy
- 3155 Chandler Pkwy
- 3153 Chandler Pkwy
- 2870 E Bakerview Rd
- 4160 Hannegan Rd
- 3606 Tree Farm Ct
- 29 Lindshire Ave
- 2812 Lindshier Ave
- 2820 Lindshier Ave
- 2824 Lindshier Ave
- 2808 Lindshier Ave
- 0 Lindshier Ave Unit 1805350
- 0 Lindshier Ave
- 2831 E Sunset Dr
- 2828 Lindshier Ave
- 2804 Lindshier Ave
- 2821 E Sunset Dr
- 2841 E Sunset Dr
- 2832 Lindshier Ave
- 2817 E Sunset Dr
- 2836 Lindshier Ave
- 2849 E Sunset Dr
- 2830 E Sunset Dr
- 2822 E Sunset Dr
- 2901 E Sunset Dr
- 2838 E Sunset Dr