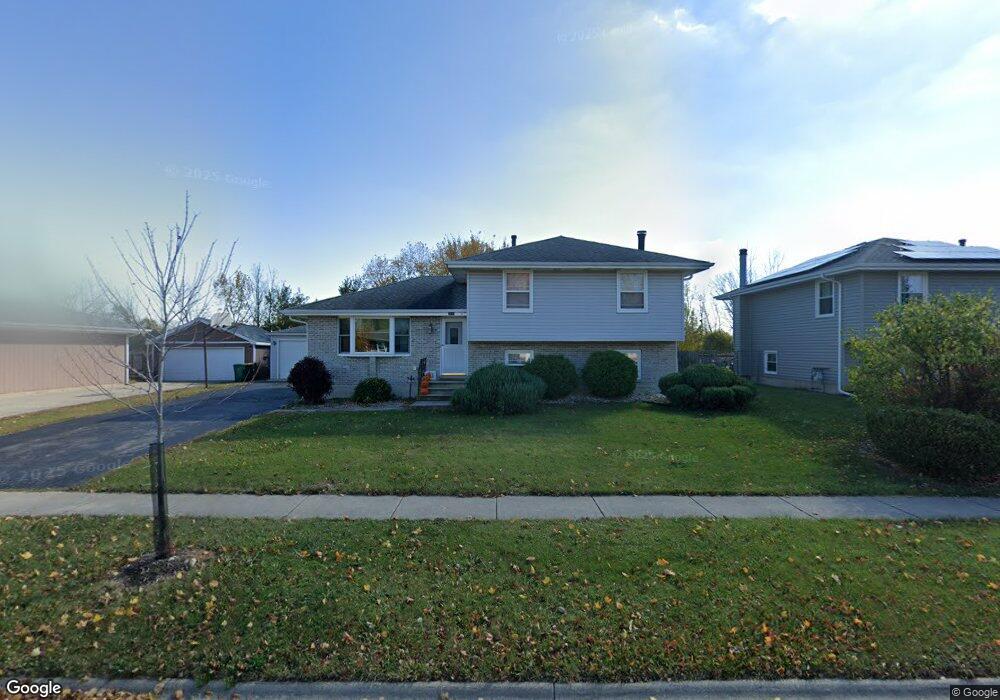
2816 Wake Island Dr Joliet, IL 60435
Estimated Value: $311,698 - $366,000
--
Bed
--
Bath
1,792
Sq Ft
$193/Sq Ft
Est. Value
About This Home
This home is located at 2816 Wake Island Dr, Joliet, IL 60435 and is currently estimated at $346,425, approximately $193 per square foot. 2816 Wake Island Dr is a home located in Will County with nearby schools including Grand Prairie Elementary School, Timber Ridge Middle School, and Plainfield Central High School.
Ownership History
Date
Name
Owned For
Owner Type
Purchase Details
Closed on
Jun 28, 2012
Sold by
Reeves James P and Reeves Laurel J
Bought by
Reeves Benjamin P and Reeves Susan M
Current Estimated Value
Home Financials for this Owner
Home Financials are based on the most recent Mortgage that was taken out on this home.
Original Mortgage
$130,240
Interest Rate
3.75%
Mortgage Type
FHA
Purchase Details
Closed on
Jun 23, 1999
Sold by
Saxby Robert D and Saxby Lois S
Bought by
Reeves James P and Reeves Laurel J
Home Financials for this Owner
Home Financials are based on the most recent Mortgage that was taken out on this home.
Original Mortgage
$85,000
Interest Rate
7.43%
Purchase Details
Closed on
Jul 31, 1996
Sold by
Martinez Victoria
Bought by
Saxby Robert D and Saxby Lois S
Home Financials for this Owner
Home Financials are based on the most recent Mortgage that was taken out on this home.
Original Mortgage
$126,350
Interest Rate
8.33%
Create a Home Valuation Report for This Property
The Home Valuation Report is an in-depth analysis detailing your home's value as well as a comparison with similar homes in the area
Home Values in the Area
Average Home Value in this Area
Purchase History
| Date | Buyer | Sale Price | Title Company |
|---|---|---|---|
| Reeves Benjamin P | $135,000 | Fidelity National Title | |
| Reeves James P | $140,000 | -- | |
| Saxby Robert D | $133,000 | -- |
Source: Public Records
Mortgage History
| Date | Status | Borrower | Loan Amount |
|---|---|---|---|
| Previous Owner | Reeves Benjamin P | $130,240 | |
| Previous Owner | Reeves James P | $85,000 | |
| Previous Owner | Saxby Robert D | $126,350 |
Source: Public Records
Tax History Compared to Growth
Tax History
| Year | Tax Paid | Tax Assessment Tax Assessment Total Assessment is a certain percentage of the fair market value that is determined by local assessors to be the total taxable value of land and additions on the property. | Land | Improvement |
|---|---|---|---|---|
| 2024 | $5,497 | $84,759 | $23,659 | $61,100 |
| 2023 | $5,497 | $76,552 | $21,368 | $55,184 |
| 2022 | $4,831 | $67,526 | $18,848 | $48,678 |
| 2021 | $4,571 | $63,108 | $17,615 | $45,493 |
| 2020 | $4,497 | $61,317 | $17,115 | $44,202 |
| 2019 | $4,333 | $58,425 | $16,308 | $42,117 |
| 2018 | $3,977 | $53,009 | $15,323 | $37,686 |
| 2017 | $3,849 | $50,374 | $14,561 | $35,813 |
| 2016 | $3,762 | $48,043 | $13,887 | $34,156 |
| 2015 | $3,541 | $45,005 | $13,009 | $31,996 |
| 2014 | $3,541 | $43,416 | $12,550 | $30,866 |
| 2013 | $3,541 | $43,416 | $12,550 | $30,866 |
Source: Public Records
Map
Nearby Homes
- 3001 Theodore St
- 1802 Maserati Dr
- 1804 Maserati Dr
- 1810 Foxfield Dr
- 1874 Corregidor St
- 2703 Oak Ridge Ln
- 1900 Essington Rd
- 1945 Calla Dr
- 1422 Citadel Dr Unit 4
- 1921 Cecily Dr
- 3107 Ingalls Ave Unit 3B
- 3107 Ingalls Ave Unit 1D
- 2528 Silver Rock Dr
- 1219 Cedarwood Dr Unit B
- 3119 Ingalls Ave Unit 2A
- 2533 Waterford Dr
- 1702 Timberline Dr
- 1112 Rosary Ln
- 1925 Timbers Edge Cir
- 1617 Timberline Dr
- 2814 Wake Island Dr
- 2902 Wake Island Dr
- 2812 Wake Island Dr
- 2817 Wake Island Dr
- 2815 Wake Island Dr
- 2904 Wake Island Dr
- 2810 Wake Island Dr
- 2903 Wake Island Dr
- 2813 Wake Island Dr
- 2808 Wake Island Dr
- 1702 Bataan St
- 2905 Wake Island Dr
- 2906 Wake Island Dr
- 1703 Corregidor St
- 1701 Bataan St
- 2806 Wake Island Dr
- 2907 Wake Island Dr
- 1704 Bataan St
- 2908 Wake Island Dr
- 1700 Corregidor St