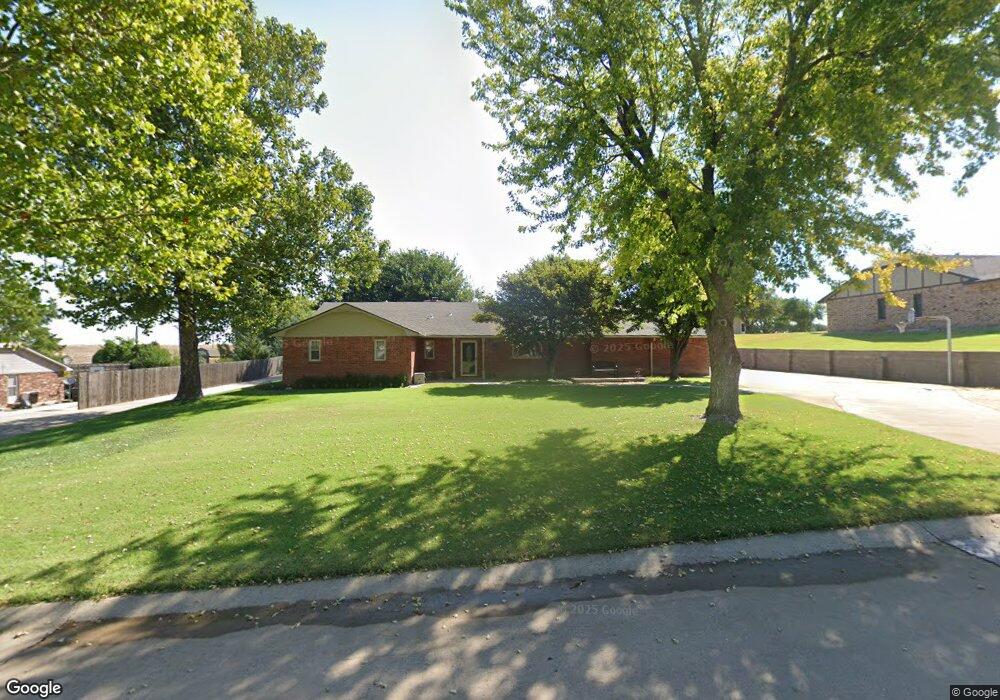
2816 Yeager Dr Woodward, OK 73801
Estimated Value: $242,000 - $295,313
3
Beds
2
Baths
1,859
Sq Ft
$148/Sq Ft
Est. Value
About This Home
This home is located at 2816 Yeager Dr, Woodward, OK 73801 and is currently estimated at $275,828, approximately $148 per square foot. 2816 Yeager Dr is a home located in Woodward County with nearby schools including Woodward High School and Woodward Christian Academy.
Ownership History
Date
Name
Owned For
Owner Type
Purchase Details
Closed on
Oct 11, 2023
Sold by
Gall David and Gall Rebecca Jean
Bought by
Gall David Shawn and Gall Rebecca Jean
Current Estimated Value
Purchase Details
Closed on
Jun 1, 2011
Sold by
Conner David
Bought by
Gall David
Home Financials for this Owner
Home Financials are based on the most recent Mortgage that was taken out on this home.
Original Mortgage
$170,563
Interest Rate
4.37%
Mortgage Type
FHA
Purchase Details
Closed on
May 20, 2011
Sold by
Conner Kendra
Bought by
Conner David
Home Financials for this Owner
Home Financials are based on the most recent Mortgage that was taken out on this home.
Original Mortgage
$170,563
Interest Rate
4.37%
Mortgage Type
FHA
Purchase Details
Closed on
Nov 12, 2002
Bought by
Conner David and Conner Kendra
Purchase Details
Closed on
Apr 28, 1999
Bought by
Taylor Kellie Ann
Create a Home Valuation Report for This Property
The Home Valuation Report is an in-depth analysis detailing your home's value as well as a comparison with similar homes in the area
Home Values in the Area
Average Home Value in this Area
Purchase History
| Date | Buyer | Sale Price | Title Company |
|---|---|---|---|
| Gall David Shawn | -- | None Listed On Document | |
| Gall David | $175,000 | -- | |
| Conner David | -- | -- | |
| Conner David | $120,000 | -- | |
| Taylor Kellie Ann | $90,000 | -- |
Source: Public Records
Mortgage History
| Date | Status | Borrower | Loan Amount |
|---|---|---|---|
| Previous Owner | Gall David | $170,563 |
Source: Public Records
Tax History Compared to Growth
Tax History
| Year | Tax Paid | Tax Assessment Tax Assessment Total Assessment is a certain percentage of the fair market value that is determined by local assessors to be the total taxable value of land and additions on the property. | Land | Improvement |
|---|---|---|---|---|
| 2025 | $2,292 | $26,902 | $7,988 | $18,914 |
| 2023 | $2,222 | $25,358 | $7,988 | $17,370 |
| 2022 | $2,193 | $24,619 | $7,988 | $16,631 |
| 2021 | $2,071 | $23,902 | $7,988 | $15,914 |
| 2020 | $2,086 | $23,902 | $7,988 | $15,914 |
| 2019 | $2,022 | $23,650 | $7,450 | $16,200 |
| 2018 | $1,992 | $22,960 | $7,204 | $15,756 |
| 2017 | $2,000 | $22,291 | $7,678 | $14,613 |
| 2016 | $1,932 | $21,230 | $1,980 | $19,250 |
| 2015 | $1,856 | $21,230 | $1,980 | $19,250 |
| 2014 | $1,856 | $21,230 | $1,980 | $19,250 |
Source: Public Records
Map
Nearby Homes
- 2805 Moelling Ln Unit 2815 Moelling Lane
- 2238 Red Cedar
- 3206 Robin Ridge Rd
- 32 Country Oaks St
- 3219 Blue Sage Dr
- 2418 Wildwood Dr
- 2211 Briarwood Dr
- 2816 Wilshire St
- 2900 Sheffield Ln
- 2523 Cherry St
- 1722 Robin Dr
- 3614 22nd St
- 1514 26th St
- 1408 27th St
- 1813 21st St
- 1802 22nd St
- 1910 20th St
- 2928 Edgewood Dr
- 2201 Cherry Ave
- 1412 24th St
- 2804 Yeager Dr
- 2824 Yeager Dr
- 2904 Yeager Dr
- 2815 Yeager Dr
- 2807 Yeager Dr
- 2823 Yeager Dr
- 2916 Yeager Dr
- 2907 Yeager Dr
- 2915 Yeager Dr
- 2924 Yeager Dr
- 2806 Moelling Ln
- 2814 Moellling Ln
- 2923 Yeager Dr
- 3006 Moelling Ln
- 2815 Moelling Ln
- 2805 Moelling Ln
- Lots 1-4,7 Moelling Ln
- 3007 Yeager Dr
- 2805 Moeliing Ln Unit 2815 Moelling Lane
- 3016 Yeager Dr