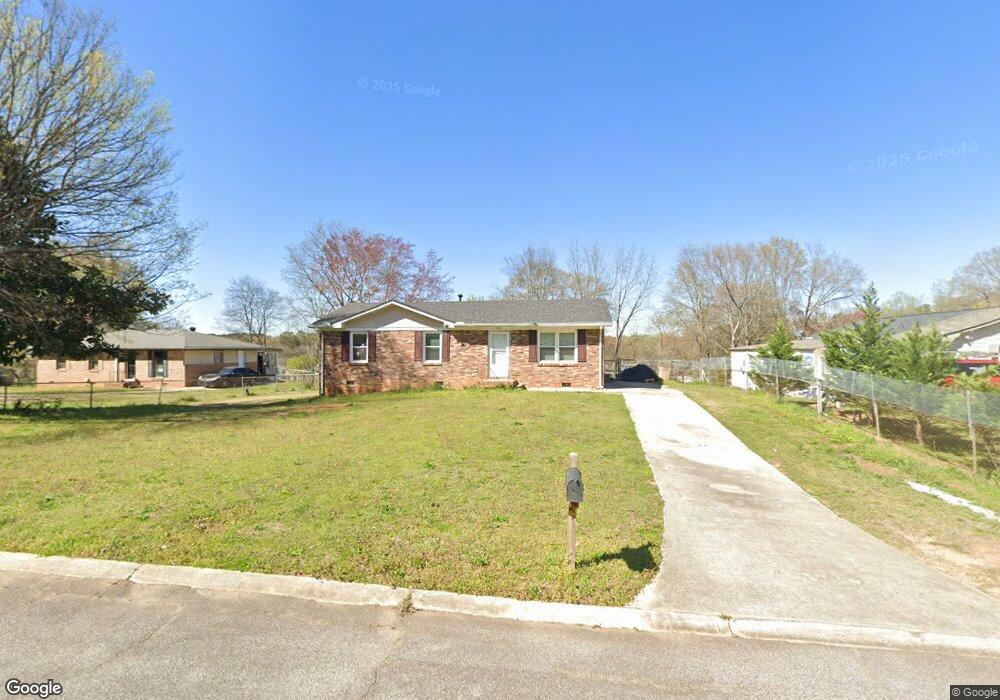
2816 Yuma Ct Morrow, GA 30260
Estimated Value: $153,000 - $201,000
3
Beds
1
Bath
1,100
Sq Ft
$155/Sq Ft
Est. Value
About This Home
This home is located at 2816 Yuma Ct, Morrow, GA 30260 and is currently estimated at $170,282, approximately $154 per square foot. 2816 Yuma Ct is a home located in Clayton County with nearby schools including Thurgood Marshall Elementary School, Adamson Middle School, and Morrow High School.
Ownership History
Date
Name
Owned For
Owner Type
Purchase Details
Closed on
Oct 18, 2022
Sold by
Nguyen The Van
Bought by
Nguyen Mong Thuy T
Current Estimated Value
Purchase Details
Closed on
Jan 2, 2009
Sold by
Hud-Housing Of Urban Dev
Bought by
Nguyen Mong T T and Nguyen Van
Purchase Details
Closed on
Mar 4, 2008
Sold by
Wells Fargo Bank Na
Bought by
Hud-Housing Of Urban Dev
Purchase Details
Closed on
Nov 8, 2005
Sold by
White Joel B
Bought by
Mcdonald Janet M
Home Financials for this Owner
Home Financials are based on the most recent Mortgage that was taken out on this home.
Original Mortgage
$88,977
Interest Rate
6%
Mortgage Type
VA
Purchase Details
Closed on
Aug 31, 2001
Sold by
Culps Helen J
Bought by
White Joel B
Home Financials for this Owner
Home Financials are based on the most recent Mortgage that was taken out on this home.
Original Mortgage
$59,885
Interest Rate
6.97%
Mortgage Type
FHA
Create a Home Valuation Report for This Property
The Home Valuation Report is an in-depth analysis detailing your home's value as well as a comparison with similar homes in the area
Home Values in the Area
Average Home Value in this Area
Purchase History
| Date | Buyer | Sale Price | Title Company |
|---|---|---|---|
| Nguyen Mong Thuy T | -- | -- | |
| Nguyen Mong T T | -- | -- | |
| Hud-Housing Of Urban Dev | -- | -- | |
| Wells Fargo Bank Na | $92,838 | -- | |
| Mcdonald Janet M | $89,500 | -- | |
| White Joel B | $60,400 | -- |
Source: Public Records
Mortgage History
| Date | Status | Borrower | Loan Amount |
|---|---|---|---|
| Previous Owner | Mcdonald Janet M | $88,977 | |
| Previous Owner | White Joel B | $59,885 |
Source: Public Records
Tax History Compared to Growth
Tax History
| Year | Tax Paid | Tax Assessment Tax Assessment Total Assessment is a certain percentage of the fair market value that is determined by local assessors to be the total taxable value of land and additions on the property. | Land | Improvement |
|---|---|---|---|---|
| 2024 | $1,431 | $36,680 | $7,200 | $29,480 |
| 2023 | $1,194 | $33,080 | $7,200 | $25,880 |
| 2022 | $1,253 | $31,920 | $7,200 | $24,720 |
| 2021 | $1,185 | $30,000 | $7,200 | $22,800 |
| 2020 | $1,176 | $29,414 | $7,200 | $22,214 |
| 2019 | $1,081 | $26,624 | $5,600 | $21,024 |
| 2018 | $1,028 | $25,327 | $5,600 | $19,727 |
| 2017 | $973 | $23,907 | $5,600 | $18,307 |
| 2016 | $985 | $24,202 | $5,600 | $18,602 |
| 2015 | $980 | $0 | $0 | $0 |
| 2014 | $935 | $23,505 | $5,600 | $17,905 |
Source: Public Records
Map
Nearby Homes
- 6287 Culver Dr
- 2808 Yuma Ct
- 2815 Somerton Dr
- 2807 Somerton Dr
- 0 Yuma Ct Unit 7207861
- 0 Yuma Ct
- 2802 Yuma Ct
- 2817 Yuma Ct
- 2825 Yuma Ct
- 6222 Culver Dr
- 2799 Somerton Dr
- 2805 Yuma Ct Unit 2
- 6284 Culver Dr
- 6292 Culver Dr
- 6276 Culver Dr
- 2794 Lake Harbin Rd
- 6300 Culver Dr Unit 2
- 0 Culver Dr Unit 7506200
- 0 Culver Dr Unit 7331894
- 0 Culver Dr Unit 8776085