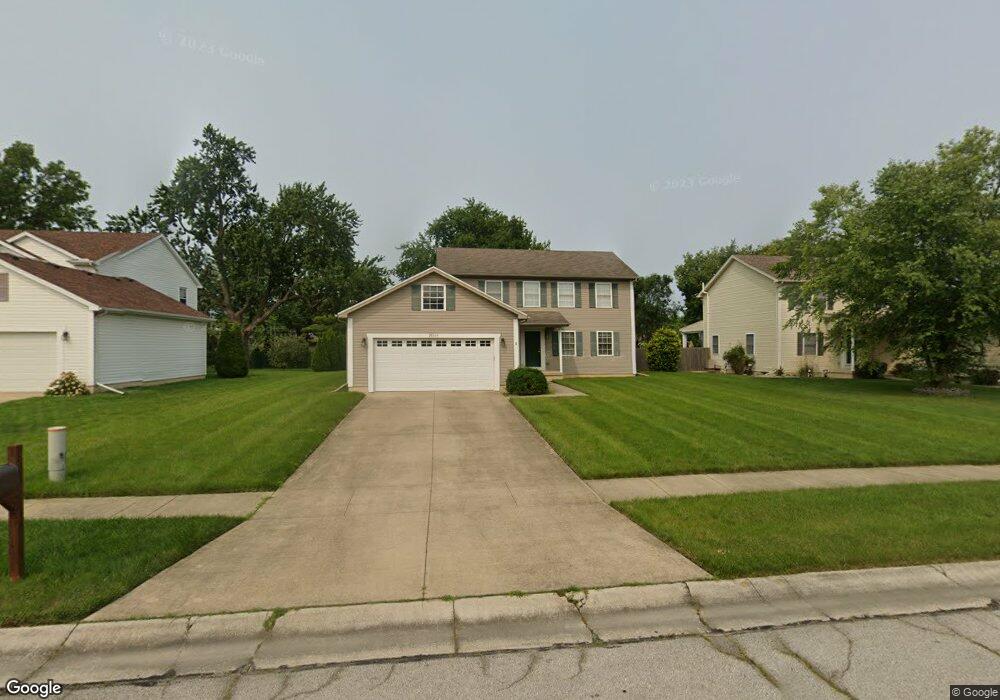
28165 Schriber St Walbridge, OH 43465
Estimated Value: $311,000 - $334,000
4
Beds
3
Baths
2,016
Sq Ft
$160/Sq Ft
Est. Value
About This Home
This home is located at 28165 Schriber St, Walbridge, OH 43465 and is currently estimated at $322,299, approximately $159 per square foot. 28165 Schriber St is a home located in Wood County with nearby schools including Lake Elementary School, Lake Middle School, and Lake High School.
Ownership History
Date
Name
Owned For
Owner Type
Purchase Details
Closed on
May 29, 2009
Sold by
Dold Investment Co
Bought by
Kelly William J and Kelly Sandra
Current Estimated Value
Home Financials for this Owner
Home Financials are based on the most recent Mortgage that was taken out on this home.
Original Mortgage
$168,300
Outstanding Balance
$104,434
Interest Rate
4.84%
Mortgage Type
Purchase Money Mortgage
Estimated Equity
$217,865
Purchase Details
Closed on
Sep 28, 2004
Sold by
Dold William H and Dold Mary Lou
Bought by
Dold Investment Co
Home Financials for this Owner
Home Financials are based on the most recent Mortgage that was taken out on this home.
Original Mortgage
$5,000,000
Interest Rate
5.89%
Mortgage Type
Credit Line Revolving
Purchase Details
Closed on
Jan 24, 2002
Sold by
Dold Homes Inc
Bought by
Dold Investment Co
Home Financials for this Owner
Home Financials are based on the most recent Mortgage that was taken out on this home.
Original Mortgage
$124,000
Interest Rate
7.16%
Create a Home Valuation Report for This Property
The Home Valuation Report is an in-depth analysis detailing your home's value as well as a comparison with similar homes in the area
Purchase History
We collect this data history from publicly available records. To have your information removed, we recommend requesting removal directly through your county’s website.
| Date | Buyer | Sale Price | Title Company |
|---|---|---|---|
| Kelly William J | $165,000 | Austin Logan Title Agency Lt | |
| Dold Investment Co | -- | -- | |
| Dold Investment Co | -- | Louisville Title Agency For |
Source: Public Records
Mortgage History
We collect this data history from publicly available records. To have your information removed, we recommend requesting removal directly through your county’s website.
| Date | Status | Borrower | Loan Amount |
|---|---|---|---|
| Open | Kelly William J | $168,300 | |
| Previous Owner | Dold Investment Co | $5,000,000 | |
| Previous Owner | Dold Investment Co | $124,000 |
Source: Public Records
Tax History
| Year | Tax Paid | Tax Assessment Tax Assessment Total Assessment is a certain percentage of the fair market value that is determined by local assessors to be the total taxable value of land and additions on the property. | Land | Improvement |
|---|---|---|---|---|
| 2025 | $3,673 | $84,000 | $8,785 | $75,215 |
| 2024 | $3,711 | $84,000 | $8,785 | $75,215 |
| 2023 | $3,711 | $84,010 | $8,790 | $75,220 |
| 2021 | $3,946 | $66,860 | $8,300 | $58,560 |
| 2020 | $3,810 | $66,860 | $8,300 | $58,560 |
| 2019 | $3,514 | $57,510 | $8,300 | $49,210 |
| 2018 | $3,512 | $57,510 | $8,300 | $49,210 |
| 2017 | $3,479 | $57,510 | $8,300 | $49,210 |
| 2016 | $2,973 | $49,600 | $8,790 | $40,810 |
| 2015 | $2,973 | $49,600 | $8,790 | $40,810 |
| 2014 | $3,122 | $49,600 | $8,790 | $40,810 |
| 2013 | $3,276 | $49,600 | $8,790 | $40,810 |
Source: Public Records
Map
Nearby Homes
- 5798 Brome Cir
- 5980 Arapaho Ave
- 5882 Cherokee Ave
- 27696 Oregon Rd Unit 120
- 7386 Lunitas Ln Unit 388
- 0 Oregon Rd Unit 10003432
- 27484 Oregon Rd Unit 144
- 27484 Oregon Rd Unit 197
- 27484 Oregon Rd Unit 86
- 27484 Oregon Rd Unit 164
- 27484 Oregon Rd Unit 42
- 7210 W Lake Rd
- 7256 Winding Brook Rd
- 28574 Lemoyne Rd
- 4136 Latcha Rd
- 211 E Perry St
- 28141 Glenwood Rd
- 0. E Broadway St
- 236 S Bridge Rd
- 238 S Bridge Rd
- 28179 Schriber St
- 28193 Schriber St
- 28137 Schriber St
- 28164 Schriber St
- 28176 E Broadway St
- 28194 E Broadway St
- 28150 Schriber St
- 28207 Schriber St
- 28125 Schriber St
- 28206 E Broadway St
- 28192 Schriber St
- 28164 E Broadway St
- 28216 E Broadway St
- 28130 Schriber St
- 28206 Schriber St
- 28121 Schriber St
- 28140 E Broadway St
- 28221 Schriber St
- 28130 E Broadway St
- 28173 Blue Grass Dr
Your Personal Tour Guide
Ask me questions while you tour the home.