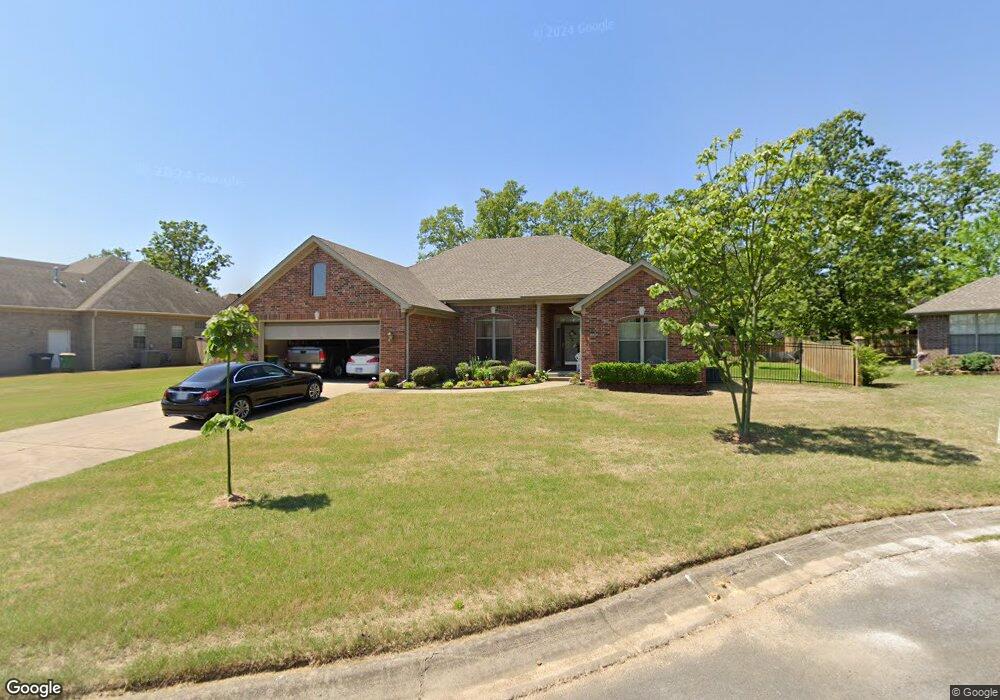
2817 Diamond Cove Sherwood, AR 72120
Estimated Value: $295,660 - $342,000
--
Bed
2
Baths
2,116
Sq Ft
$151/Sq Ft
Est. Value
About This Home
This home is located at 2817 Diamond Cove, Sherwood, AR 72120 and is currently estimated at $320,415, approximately $151 per square foot. 2817 Diamond Cove is a home located in Pulaski County with nearby schools including Oakbrooke Elementary School, Sylvan Hills Middle School, and Sylvan Hills High School.
Ownership History
Date
Name
Owned For
Owner Type
Purchase Details
Closed on
Mar 11, 2013
Sold by
Ridgell Malvin D and Ridgell Marilyn E
Bought by
Ridgell Malvin D
Current Estimated Value
Home Financials for this Owner
Home Financials are based on the most recent Mortgage that was taken out on this home.
Original Mortgage
$192,000
Outstanding Balance
$135,796
Interest Rate
3.59%
Mortgage Type
New Conventional
Estimated Equity
$184,619
Purchase Details
Closed on
Aug 1, 2006
Sold by
Ridgell Marilyn E and Ridgell Malvin D
Bought by
Ridgell Malvin D and Ridgell Marilyn E
Purchase Details
Closed on
Oct 24, 2005
Sold by
Williamson Remodeling & Construction Inc
Bought by
Ridgell Malvin D and Ridgell Marilyn E
Home Financials for this Owner
Home Financials are based on the most recent Mortgage that was taken out on this home.
Original Mortgage
$227,156
Interest Rate
5.73%
Mortgage Type
VA
Create a Home Valuation Report for This Property
The Home Valuation Report is an in-depth analysis detailing your home's value as well as a comparison with similar homes in the area
Home Values in the Area
Average Home Value in this Area
Purchase History
| Date | Buyer | Sale Price | Title Company |
|---|---|---|---|
| Ridgell Malvin D | -- | Professional Land Title Comp | |
| Ridgell Malvin D | -- | None Available | |
| Ridgell Malvin D | $220,000 | -- |
Source: Public Records
Mortgage History
| Date | Status | Borrower | Loan Amount |
|---|---|---|---|
| Open | Ridgell Malvin D | $192,000 | |
| Closed | Ridgell Malvin D | $227,156 |
Source: Public Records
Tax History Compared to Growth
Tax History
| Year | Tax Paid | Tax Assessment Tax Assessment Total Assessment is a certain percentage of the fair market value that is determined by local assessors to be the total taxable value of land and additions on the property. | Land | Improvement |
|---|---|---|---|---|
| 2025 | $1,957 | $48,731 | $5,400 | $43,331 |
| 2024 | $1,957 | $48,731 | $5,400 | $43,331 |
| 2023 | $1,957 | $48,731 | $5,400 | $43,331 |
| 2022 | $2,212 | $48,731 | $5,400 | $43,331 |
| 2021 | $2,148 | $39,570 | $6,030 | $33,540 |
| 2020 | $1,763 | $39,570 | $6,030 | $33,540 |
| 2019 | $1,763 | $39,570 | $6,030 | $33,540 |
| 2018 | $1,788 | $39,570 | $6,030 | $33,540 |
| 2017 | $1,788 | $39,570 | $6,030 | $33,540 |
| 2016 | $1,788 | $42,450 | $6,750 | $35,700 |
| 2015 | $2,060 | $40,558 | $6,750 | $33,808 |
| 2014 | $2,060 | $40,558 | $6,750 | $33,808 |
Source: Public Records
Map
Nearby Homes
- 8340 Sapphire Cove
- 109 Carnelian Dr
- 8416 E Woodruff Ave
- 656 Feldspar Dr
- 616 Feldspar Dr
- 124 Obsidian Dr
- 9016 Stillwater Rd
- 9008 Stillwater Rd
- 9108 Stillwater Rd
- 9100 Stillwater Rd
- 8824 Stillwater Rd
- 8817 Stillwater Rd
- 2712 E Maryland Ave
- 2708 Chert Cove
- 2116 Little Ridge Ct
- 119 Riverstone Cove
- 8552 Rapid Water Dr
- 8560 Rapid Water Dr
- 112 Riverstone Cove
- 124 Riverstone Cove
- 2809 Diamond Cove
- 2825 Diamond Cove
- 2801 Diamond Cove
- 2816 Diamond Cove
- 248 Pumice Dr
- 2824 Diamond Cove
- 2800 Diamond Cove
- 2900 Moonstone Cove
- 2808 Diamond Cove
- 0 Diamond Cove Unit 17032677
- 240 Pumice Dr
- 0 Moonstone Cove Unit 18002991
- 2916 Moonstone Cove
- 2832 Diamond Cove
- 2824 Moonstone Cove
- 8433 Garnet Cove
- 2816 Moonstone Cove
- 232 Pumice Dr
- 2809 Amber Cove
- 2701 Emerald Cove