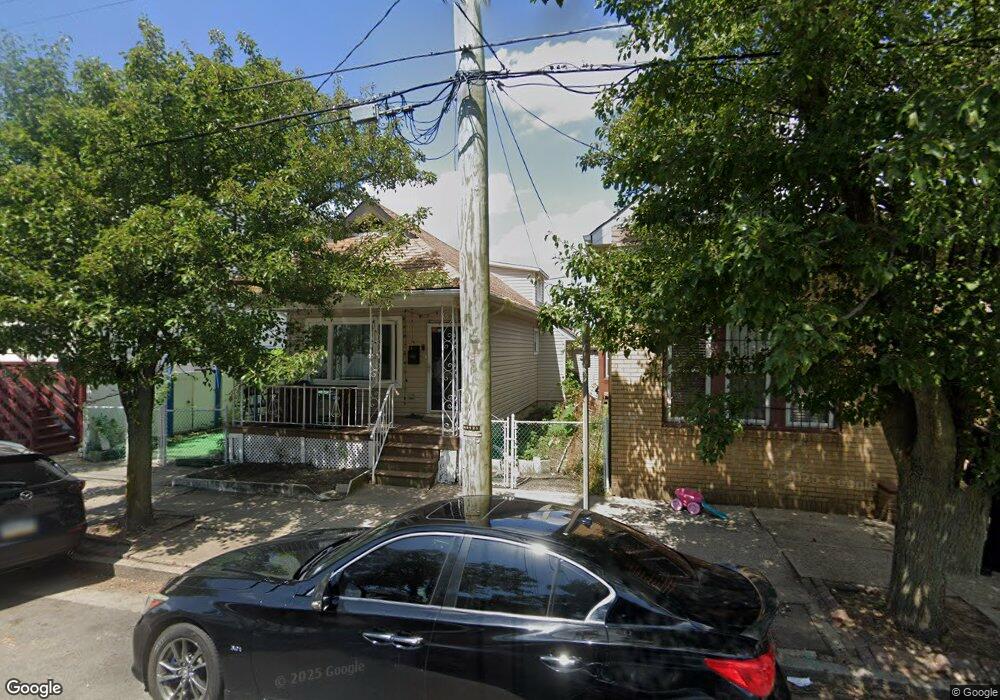
2817 Fairmount Ave Atlantic City, NJ 08401
Chelsea NeighborhoodEstimated Value: $273,000 - $360,000
--
Bed
--
Bath
1,116
Sq Ft
$283/Sq Ft
Est. Value
About This Home
This home is located at 2817 Fairmount Ave, Atlantic City, NJ 08401 and is currently estimated at $315,575, approximately $282 per square foot. 2817 Fairmount Ave is a home located in Atlantic County with nearby schools including Brighton Avenue School, Atlantic City High School, and Our Lady Star of the Sea Regional School.
Ownership History
Date
Name
Owned For
Owner Type
Purchase Details
Closed on
Feb 22, 2019
Sold by
Martinez Gloria and Ramos Rafael
Bought by
Ali Shaikh S and Akter Nargis
Current Estimated Value
Home Financials for this Owner
Home Financials are based on the most recent Mortgage that was taken out on this home.
Original Mortgage
$85,850
Outstanding Balance
$75,324
Interest Rate
4.4%
Mortgage Type
New Conventional
Estimated Equity
$240,251
Purchase Details
Closed on
Sep 28, 1999
Sold by
Diclemente Mary and Frumento Joseph
Bought by
Martinez Gloria E and Ramos Rafael
Home Financials for this Owner
Home Financials are based on the most recent Mortgage that was taken out on this home.
Original Mortgage
$67,894
Interest Rate
7.81%
Mortgage Type
FHA
Purchase Details
Closed on
Mar 12, 1997
Sold by
Granieri Elvira
Bought by
Diclemente Mary and Frumento Joseph F
Create a Home Valuation Report for This Property
The Home Valuation Report is an in-depth analysis detailing your home's value as well as a comparison with similar homes in the area
Home Values in the Area
Average Home Value in this Area
Purchase History
| Date | Buyer | Sale Price | Title Company |
|---|---|---|---|
| Ali Shaikh S | $101,000 | None Available | |
| Martinez Gloria E | $68,500 | Commonwealth Land Title Ins | |
| Diclemente Mary | $60,000 | The Title Company |
Source: Public Records
Mortgage History
| Date | Status | Borrower | Loan Amount |
|---|---|---|---|
| Open | Ali Shaikh S | $85,850 | |
| Previous Owner | Martinez Gloria E | $67,894 |
Source: Public Records
Tax History Compared to Growth
Tax History
| Year | Tax Paid | Tax Assessment Tax Assessment Total Assessment is a certain percentage of the fair market value that is determined by local assessors to be the total taxable value of land and additions on the property. | Land | Improvement |
|---|---|---|---|---|
| 2025 | $4,425 | $128,200 | $56,200 | $72,000 |
| 2024 | $4,425 | $128,200 | $56,200 | $72,000 |
| 2023 | $4,842 | $128,200 | $56,200 | $72,000 |
| 2022 | $4,842 | $128,200 | $56,200 | $72,000 |
| 2021 | $5,001 | $128,200 | $56,200 | $72,000 |
| 2020 | $5,043 | $128,200 | $56,200 | $72,000 |
| 2019 | $5,677 | $142,500 | $71,250 | $71,250 |
| 2018 | $5,035 | $142,500 | $71,250 | $71,250 |
| 2017 | $4,875 | $142,500 | $71,250 | $71,250 |
| 2016 | $5,501 | $142,500 | $71,250 | $71,250 |
| 2015 | $7,200 | $210,400 | $139,600 | $70,800 |
| 2014 | $7,044 | $210,400 | $139,600 | $70,800 |
Source: Public Records
Map
Nearby Homes
- 2827 Fenton Place
- 2913 Fairmount Ave
- 113 N Brighton Ave
- 222 N California Ave
- 2801 Arctic Ave
- 3107 Fairmount Ave
- 121 N Montpelier Ave
- 121 N Montpelier Ave Unit B
- 27 N Iowa Ave
- 213 Arizona Ave
- 205 Arizona Ave
- 23 N Iowa Ave
- 124 N Texas Ave Unit Lot 6
- 124 N Texas Ave Unit Lot 5
- 239 Arizona Ave
- 228 N Texas Ave
- 20 N Chelsea Ave
- 122 N Texas Ave Unit Lot 7
- 114 N Texas Ave
- 106 N Texas Ave
- 2815 Fairmount Ave
- 2819 Fairmount Ave
- 2813 Fairmount Ave
- 2831 Fairmount Ave
- 2811 Fairmount Ave
- 2833 Fairmount Ave
- 201 N Brighton Ave
- 2809 Fairmount Ave
- 2835 Fairmount Ave
- 2837 Fairmount Ave
- 2807 Fairmount Ave
- 2828 Fairmount Ave
- 2816 Fairmount Ave
- 2831 Fenton Place
- 2814 Fairmount Ave
- 209 N Brighton Ave
- 2830 Fairmount Ave
- 2812 Fairmount Ave
- 2810 Fairmount Ave
- 2834 Fairmount Ave