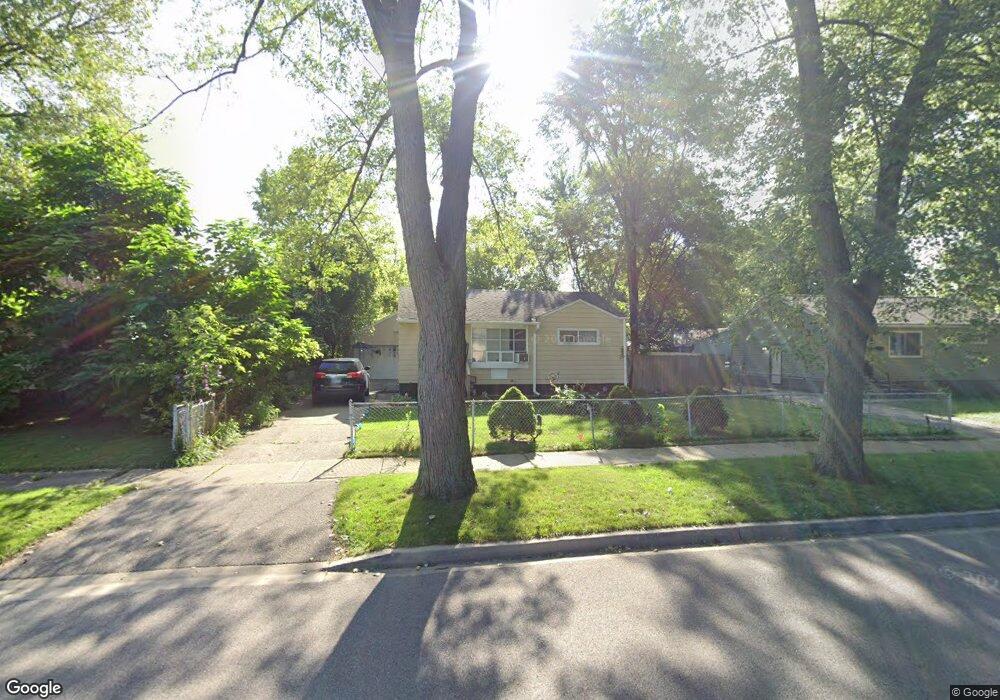
2817 N Butrick St Waukegan, IL 60087
Lake County Gardens NeighborhoodEstimated Value: $191,000 - $200,000
2
Beds
1
Bath
768
Sq Ft
$256/Sq Ft
Est. Value
About This Home
This home is located at 2817 N Butrick St, Waukegan, IL 60087 and is currently estimated at $196,422, approximately $255 per square foot. 2817 N Butrick St is a home located in Lake County with nearby schools including Little Fort Elementary School, Jack Benny Middle School, and Waukegan High School.
Ownership History
Date
Name
Owned For
Owner Type
Purchase Details
Closed on
Aug 3, 2022
Sold by
Lobue Corporation
Bought by
Lobue Family Trust and Lobue
Current Estimated Value
Purchase Details
Closed on
Jul 8, 2005
Sold by
Flores Juan O and Flores Juan F
Bought by
Lobue Corp
Purchase Details
Closed on
Feb 28, 2003
Sold by
Servis James W and Servis Christine A
Bought by
Flores Juan O and Flores Juan F
Home Financials for this Owner
Home Financials are based on the most recent Mortgage that was taken out on this home.
Original Mortgage
$112,208
Interest Rate
5.76%
Mortgage Type
FHA
Purchase Details
Closed on
Mar 31, 1994
Sold by
Post Katherine C
Bought by
Servis James W and Abalos Christine A
Home Financials for this Owner
Home Financials are based on the most recent Mortgage that was taken out on this home.
Original Mortgage
$83,600
Interest Rate
7.17%
Create a Home Valuation Report for This Property
The Home Valuation Report is an in-depth analysis detailing your home's value as well as a comparison with similar homes in the area
Home Values in the Area
Average Home Value in this Area
Purchase History
| Date | Buyer | Sale Price | Title Company |
|---|---|---|---|
| Lobue Family Trust | $144,000 | Smythe Terry J | |
| Lobue Corp | $135,000 | St | |
| Flores Juan O | $114,000 | First American Title | |
| Servis James W | $54,666 | First American Title |
Source: Public Records
Mortgage History
| Date | Status | Borrower | Loan Amount |
|---|---|---|---|
| Previous Owner | Flores Juan O | $112,208 | |
| Previous Owner | Servis James W | $83,600 |
Source: Public Records
Tax History Compared to Growth
Tax History
| Year | Tax Paid | Tax Assessment Tax Assessment Total Assessment is a certain percentage of the fair market value that is determined by local assessors to be the total taxable value of land and additions on the property. | Land | Improvement |
|---|---|---|---|---|
| 2024 | $4,741 | $55,650 | $8,282 | $47,368 |
| 2023 | $4,158 | $50,273 | $7,481 | $42,792 |
| 2022 | $4,158 | $42,535 | $7,128 | $35,407 |
| 2021 | $3,876 | $37,176 | $6,171 | $31,005 |
| 2020 | $3,926 | $34,634 | $5,749 | $28,885 |
| 2019 | $3,951 | $31,736 | $5,268 | $26,468 |
| 2018 | $3,329 | $25,745 | $6,712 | $19,033 |
| 2017 | $3,240 | $22,777 | $5,938 | $16,839 |
| 2016 | $3,059 | $19,792 | $5,160 | $14,632 |
| 2015 | $2,992 | $17,714 | $4,618 | $13,096 |
| 2014 | $3,271 | $19,330 | $5,068 | $14,262 |
| 2012 | $4,008 | $20,944 | $5,491 | $15,453 |
Source: Public Records
Map
Nearby Homes
- 1612 Whitney St
- 1636 Rice St
- 2613 N Lewis Ave
- 37905 N Loyola Ave
- 2350 N Lewis Ave
- 37966 N Cornell Rd
- 2232 Walnut St
- 3211 Rugby Ct
- 301 W Eagle Ct
- 38127 N Shore Ave
- 38362 N Manor Ave
- 3411 N Lewis Ave
- 0 Traditions Dr
- 10241 W Bairstow Ave
- 3101 Country Club Ln
- 2708 Dana Ave
- 2705 Dana Ave
- 1905 Linden Ave
- 37231 N Ganster Rd
- 12312 W Audrey Ave
- 2825 N Butrick St
- 2813 N Butrick St
- 2826 N Pine St
- 2820 N Pine St
- 2829 N Butrick St
- 2809 N Butrick St
- 2832 N Pine St
- 2816 N Pine St
- 2818 N Butrick St
- 2814 N Butrick St
- 2822 N Butrick St
- 2836 N Pine St
- 2833 N Butrick St Unit 4
- 2810 N Pine St
- 2805 N Butrick St
- 2826 N Butrick St
- 2810 N Butrick St
- 2825 N Pine St
- 2840 N Pine St
- 2804 N Pine St