Estimated Value: $481,000 - $537,000
--
Bed
--
Bath
1,288
Sq Ft
$394/Sq Ft
Est. Value
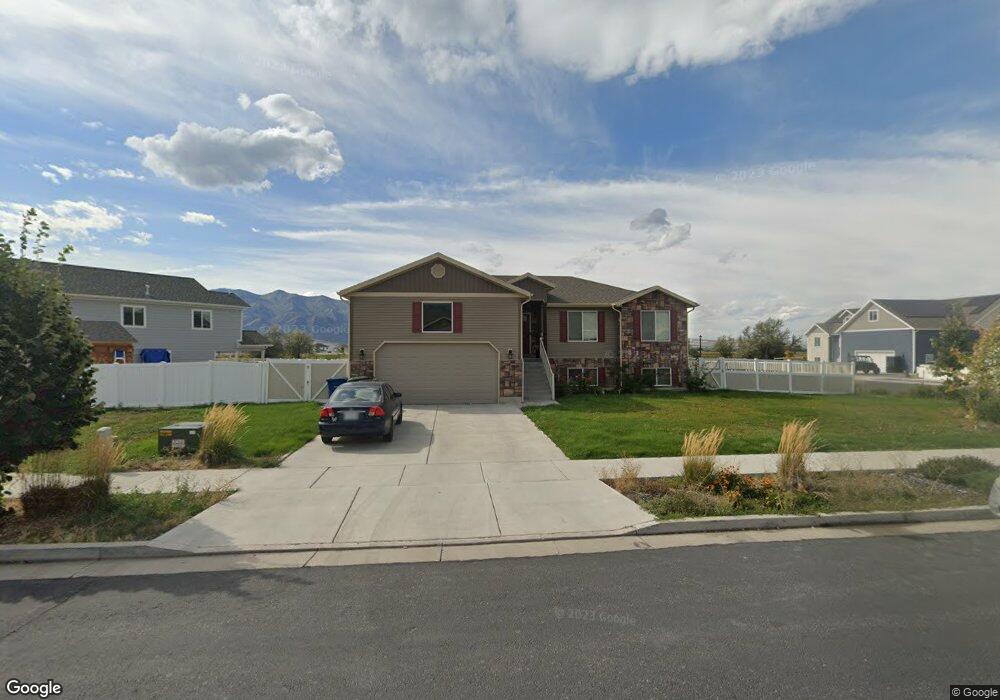
About This Home
This home is located at 2817 S 1150 W, Logan, UT 84321 and is currently estimated at $508,032, approximately $394 per square foot. 2817 S 1150 W is a home with nearby schools including Nibley School, South Cache Middle School, and Spring Creek Middle School.
Ownership History
Date
Name
Owned For
Owner Type
Purchase Details
Closed on
Sep 28, 2022
Sold by
Franke Brayden C
Bought by
Franke Brayden C and Franke Rachel
Current Estimated Value
Purchase Details
Closed on
Nov 10, 2015
Sold by
Neighborhood Nonprofit Housing Corporati
Bought by
Franke Brayden C
Home Financials for this Owner
Home Financials are based on the most recent Mortgage that was taken out on this home.
Original Mortgage
$750
Interest Rate
3.76%
Mortgage Type
Unknown
Create a Home Valuation Report for This Property
The Home Valuation Report is an in-depth analysis detailing your home's value as well as a comparison with similar homes in the area
Home Values in the Area
Average Home Value in this Area
Purchase History
| Date | Buyer | Sale Price | Title Company |
|---|---|---|---|
| Franke Brayden C | -- | -- | |
| Franke Brayden C | -- | Cache Title Logan |
Source: Public Records
Mortgage History
| Date | Status | Borrower | Loan Amount |
|---|---|---|---|
| Previous Owner | Franke Brayden C | $750 | |
| Previous Owner | Franke Brayden C | $188,116 |
Source: Public Records
Tax History Compared to Growth
Tax History
| Year | Tax Paid | Tax Assessment Tax Assessment Total Assessment is a certain percentage of the fair market value that is determined by local assessors to be the total taxable value of land and additions on the property. | Land | Improvement |
|---|---|---|---|---|
| 2024 | $255 | $317,585 | $0 | $0 |
| 2023 | $2,459 | $286,605 | $0 | $0 |
| 2022 | $2,560 | $286,605 | $0 | $0 |
| 2021 | $1,790 | $311,136 | $65,000 | $246,136 |
| 2020 | $1,686 | $279,032 | $65,000 | $214,032 |
| 2019 | $1,768 | $279,032 | $65,000 | $214,032 |
| 2018 | $1,501 | $231,100 | $40,000 | $191,100 |
| 2017 | $1,497 | $122,100 | $0 | $0 |
| 2016 | $1,514 | $28,000 | $0 | $0 |
| 2015 | $345 | $28,000 | $0 | $0 |
| 2014 | $337 | $28,000 | $0 | $0 |
Source: Public Records
Map
Nearby Homes
- 2814 S 1150 W
- 2899 S 1080 W
- 2544 S 1100 W
- 907 W 2980 S
- 2616 S 900 W
- 2485 S 1296 W
- 3074 S 800 W
- 1045 W 2400 S
- 3093 S 1600 W
- 3369 1010 W
- 2237 S 1150 W Unit 39
- 3395 1010 W
- 3401 1010 W
- 3261 S 1500 W
- 1174 3410 S
- 2615 S 600 W
- 2203 S 1150 W Unit 43
- Alpine Plan at Firefly Estates
- Monroe Plan at Firefly Estates
- Gala Plan at Firefly Estates
- 2817 S 1150 W Unit 2817 B
- 2831 S 1150 W Unit 3
- 2831 S 1150 W
- 2893 S 1150 W
- 2785 S 1150 W
- 2826 S 1150 W
- 2838 S 1150 W
- 1179 W 2800 S Unit 2
- 2786 S 1150 W
- 2813 S 1100 W
- 2850 S 1150 W
- 2771 S 1150 W
- 2829 S 1100 W
- 2847 S 1100 W
- 2774 S 1150 W
- 2857 S 1150 W
- 2861 S 1100 W
- 2866 S 1150 W
- 2757 S 1150 W
- 2773 S 1100 W