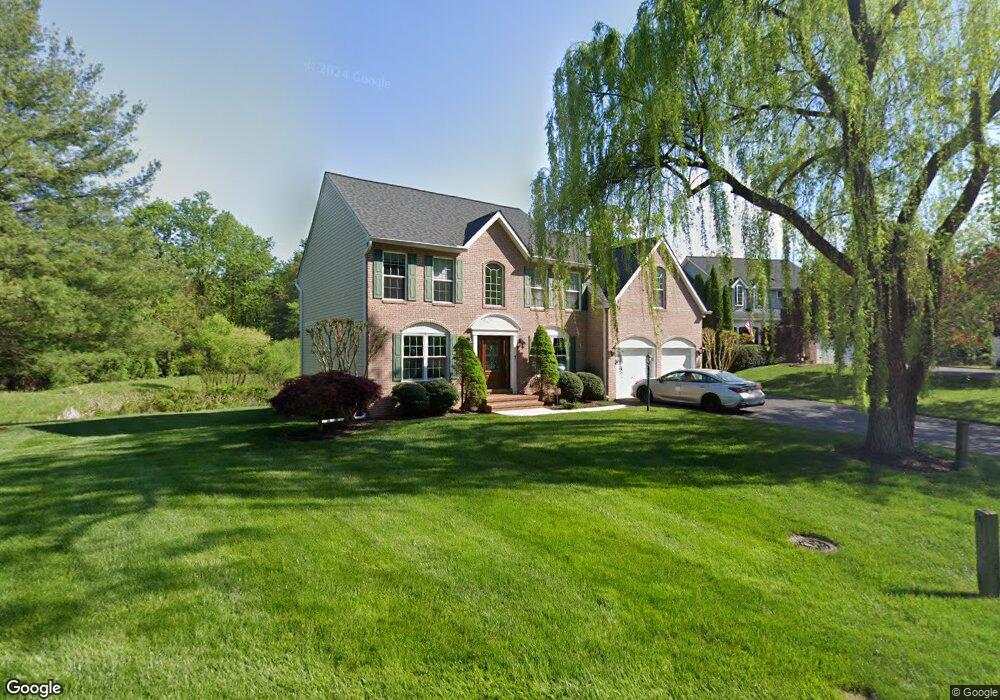
2817 Stansway Ct Ellicott City, MD 21043
Estimated Value: $917,811 - $960,000
6
Beds
4
Baths
3,132
Sq Ft
$301/Sq Ft
Est. Value
About This Home
This home is located at 2817 Stansway Ct, Ellicott City, MD 21043 and is currently estimated at $943,453, approximately $301 per square foot. 2817 Stansway Ct is a home located in Howard County with nearby schools including Hollifield Station Elementary School, Patapsco Middle School, and Mount Hebron High School.
Ownership History
Date
Name
Owned For
Owner Type
Purchase Details
Closed on
Oct 8, 2010
Sold by
Zwanenburg Frans L
Bought by
Zwanenberg Frans L and Zwanenbrug Rosangela
Current Estimated Value
Home Financials for this Owner
Home Financials are based on the most recent Mortgage that was taken out on this home.
Original Mortgage
$572,600
Outstanding Balance
$387,726
Interest Rate
4.87%
Mortgage Type
FHA
Estimated Equity
$555,727
Purchase Details
Closed on
Jul 2, 2009
Sold by
Larson Carl F
Bought by
Zwanenburg Frans L
Home Financials for this Owner
Home Financials are based on the most recent Mortgage that was taken out on this home.
Original Mortgage
$569,800
Interest Rate
5.58%
Purchase Details
Closed on
Dec 19, 1997
Sold by
Philip Feaga J
Bought by
Larson Carl F and Larson Gloria
Create a Home Valuation Report for This Property
The Home Valuation Report is an in-depth analysis detailing your home's value as well as a comparison with similar homes in the area
Home Values in the Area
Average Home Value in this Area
Purchase History
| Date | Buyer | Sale Price | Title Company |
|---|---|---|---|
| Zwanenberg Frans L | -- | -- | |
| Zwanenburg Frans L | $599,000 | -- | |
| Larson Carl F | $306,537 | -- |
Source: Public Records
Mortgage History
| Date | Status | Borrower | Loan Amount |
|---|---|---|---|
| Open | Zwanenberg Frans L | $572,600 | |
| Previous Owner | Zwanenburg Frans L | $569,800 | |
| Closed | Larson Carl F | -- |
Source: Public Records
Tax History Compared to Growth
Tax History
| Year | Tax Paid | Tax Assessment Tax Assessment Total Assessment is a certain percentage of the fair market value that is determined by local assessors to be the total taxable value of land and additions on the property. | Land | Improvement |
|---|---|---|---|---|
| 2025 | $10,498 | $719,900 | $0 | $0 |
| 2024 | $10,498 | $676,300 | $237,500 | $438,800 |
| 2023 | $10,270 | $671,567 | $0 | $0 |
| 2022 | $7,509 | $666,833 | $0 | $0 |
| 2021 | $9,969 | $662,100 | $244,000 | $418,100 |
| 2020 | $9,843 | $644,667 | $0 | $0 |
| 2019 | $9,045 | $627,233 | $0 | $0 |
| 2018 | $8,876 | $609,800 | $198,500 | $411,300 |
| 2017 | $8,764 | $609,800 | $0 | $0 |
| 2016 | -- | $601,600 | $0 | $0 |
| 2015 | -- | $597,500 | $0 | $0 |
| 2014 | -- | $573,167 | $0 | $0 |
Source: Public Records
Map
Nearby Homes
- 2796 Rogers Ave
- 2550 Kensington Gardens Unit U205
- 2540 Kensington Gardens Unit 303
- 2540 Kensington Gardens
- 2540 Kensington Gardens
- 2832 Willow Ln
- 8580 Sunell Ln
- 2530 Kensington Gardens
- 2520 Kensington Gardens
- 2992 Normandy Dr
- 3157 Sonia Trail
- 2410 Vineyard Springs Way
- 8800 Stonehouse Dr
- 3011 Dexter Dr Unit 104
- 3309 Hibiscus Ct
- 2540 River Ridge Trail
- 8960 Carls Ct Unit A
- 2888 Millers Way Dr
- 9155 Victoria Dr
- 8369 Governor Grayson Way
- 2813 Stansway Ct
- 2809 Stansway Ct
- 2820 Stansway Ct
- 2805 Stansway Ct
- 2824 Stansway Ct
- 2816 Stansway Ct
- 2821 Brian Ct
- 2812 Stansway Ct
- 2817 Brian Ct
- 2832 Stansway Ct
- 2801 Stansway Ct
- 2828 Stansway Ct
- 2808 Stansway Ct
- 2803 Brian Ct
- 2825 Brian Ct
- 2805 Brian Ct
- 2813 Brian Ct
- 2809 Brian Ct
- 2804 Stansway Ct
- 2828 Brian Ct