
Seller's Agent in 2015
Pamela Walters
The Pamela Walters Group
(903) 581-3900
157 Total Sales
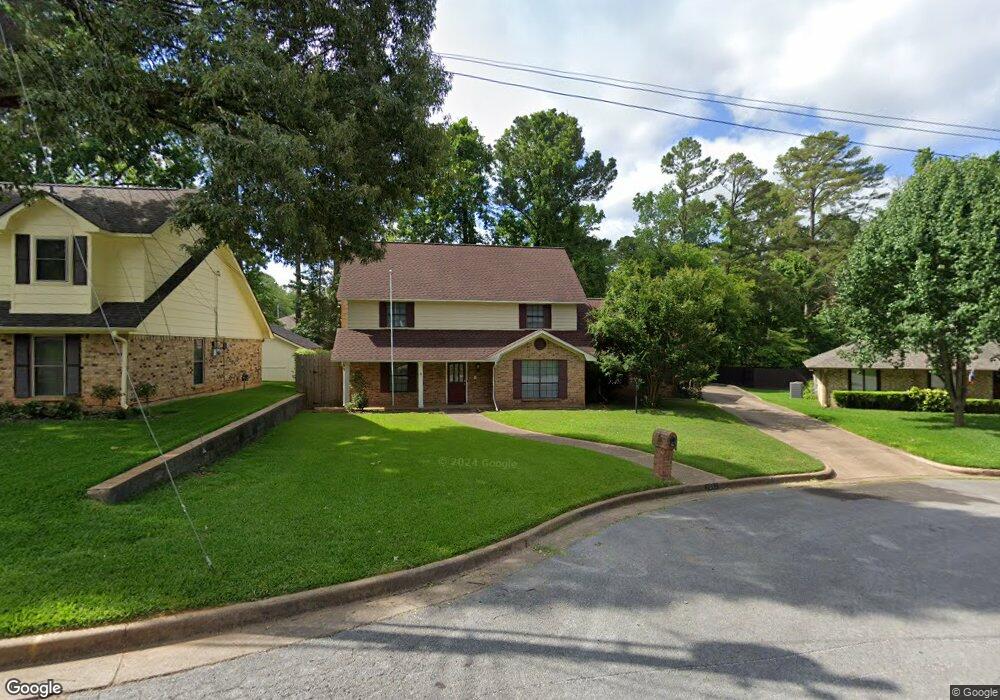
Estimated Value: $311,000 - $342,000
Beautiful Home! Great 3/2/2 home featuring 2 Living areas, one with custom Built-Ins and a Brick fireplace, Sunroom, Large bedrooms, Separate Formal Dining, Breakfast Room, Kitchen and Laundry room. Located on a quiet cul-de-sac. This house is a must see!
| Date | Buyer | Sale Price | Title Company |
|---|---|---|---|
| Kabir Aley A | -- | None Available |
| Date | Status | Borrower | Loan Amount |
|---|---|---|---|
| Open | Kabir Aley A | $94,400 |
| Date | Event | Price | List to Sale | Price per Sq Ft | Prior Sale |
|---|---|---|---|---|---|
| 08/15/2015 08/15/15 | Rented | $1,600 | -3.0% | -- | |
| 07/14/2015 07/14/15 | Under Contract | -- | -- | -- | |
| 10/30/2014 10/30/14 | Rented | $1,650 | +3.1% | -- | |
| 10/02/2014 10/02/14 | Under Contract | -- | -- | -- | |
| 07/30/2014 07/30/14 | Rented | $1,600 | -- | -- | |
| 07/30/2014 07/30/14 | Under Contract | -- | -- | -- | |
| 06/18/2014 06/18/14 | Sold | -- | -- | -- | View Prior Sale |
| 04/28/2014 04/28/14 | Pending | -- | -- | -- |
| Year | Tax Paid | Tax Assessment Tax Assessment Total Assessment is a certain percentage of the fair market value that is determined by local assessors to be the total taxable value of land and additions on the property. | Land | Improvement |
|---|---|---|---|---|
| 2025 | $5,692 | $308,831 | $27,301 | $281,530 |
| 2024 | $5,692 | $334,562 | $30,800 | $303,762 |
| 2023 | $5,263 | $301,931 | $30,800 | $271,131 |
| 2022 | $5,093 | $259,949 | $30,800 | $229,149 |
| 2021 | $4,408 | $210,110 | $30,800 | $179,310 |
| 2020 | $4,248 | $198,542 | $30,800 | $167,742 |
| 2019 | $2,617 | $172,607 | $15,400 | $157,207 |
| 2018 | $3,713 | $170,724 | $15,400 | $155,324 |
| 2017 | $3,645 | $170,724 | $15,400 | $155,324 |
| 2016 | $3,601 | $168,684 | $15,400 | $153,284 |
| 2015 | $3,270 | $162,277 | $15,400 | $146,877 |
| 2014 | $3,270 | $153,910 | $15,400 | $138,510 |
Seller's Agent in 2015
Pamela Walters
The Pamela Walters Group
(903) 581-3900
157 Total Sales
J
Seller Co-Listing Agent in 2015
Jamie Brown
The Pamela Walters Group
J
Buyer's Agent in 2015
Julia Coody
The Pamela Walters Group
(903) 245-7468
17 Total Sales
Buyer's Agent in 2014
Bart Brown
The Pamela Walters Group
(903) 570-2399
3 Total Sales
Buyer's Agent in 2014
DAVID KURTZ
Dwell Realty
(903) 525-9317
329 Total Sales
K
Buyer's Agent in 2014
Katie Heimer
Dwell Realty
(903) 312-1038
27 Total Sales