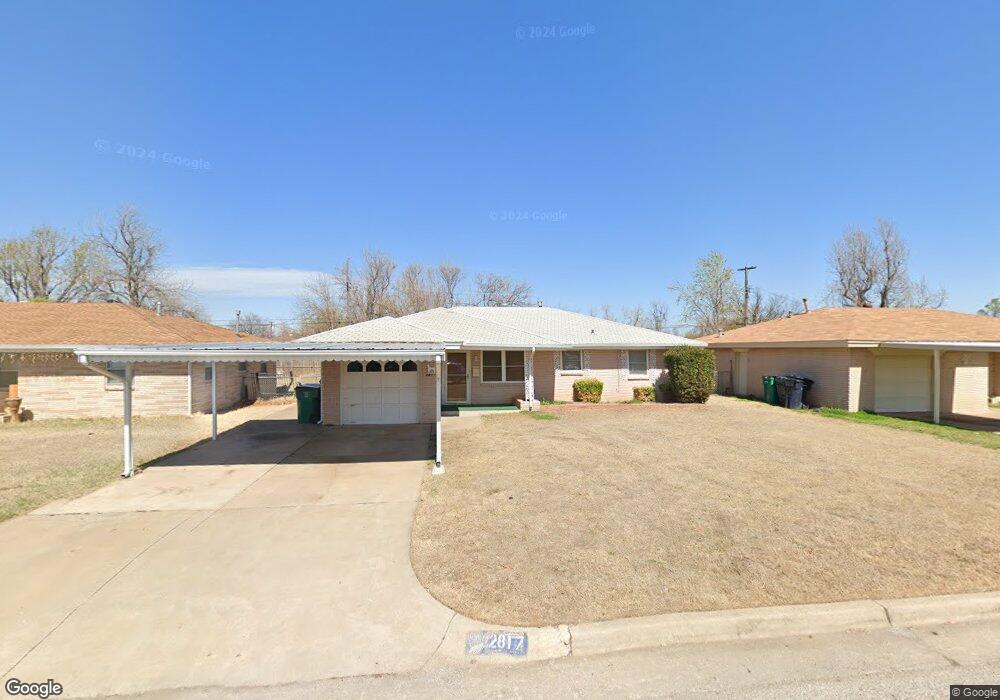
2817 SW 77th St Oklahoma City, OK 73159
Meadowcliff NeighborhoodEstimated Value: $135,000 - $150,765
3
Beds
2
Baths
1,000
Sq Ft
$145/Sq Ft
Est. Value
About This Home
This home is located at 2817 SW 77th St, Oklahoma City, OK 73159 and is currently estimated at $144,941, approximately $144 per square foot. 2817 SW 77th St is a home located in Oklahoma County with nearby schools including John Glenn Elementary School, Western Heights Middle School, and Western Heights High School.
Ownership History
Date
Name
Owned For
Owner Type
Purchase Details
Closed on
Feb 19, 2019
Sold by
Aynes Family Revocable Trust
Bought by
Homeland Central Properties Llc
Current Estimated Value
Home Financials for this Owner
Home Financials are based on the most recent Mortgage that was taken out on this home.
Original Mortgage
$62,241
Outstanding Balance
$39,862
Interest Rate
4.4%
Mortgage Type
Purchase Money Mortgage
Estimated Equity
$105,079
Purchase Details
Closed on
Oct 12, 2007
Sold by
Nickell Dalisa K and The Doretha M Duggins Revocabl
Bought by
Aynes Ted G and Aynes Linda J
Purchase Details
Closed on
Jun 2, 2005
Sold by
Duggins Doretha M
Bought by
Duggins Doretha M and Doretha M Duggins Revocable Li
Purchase Details
Closed on
Apr 7, 2005
Sold by
Pitt Robert Bruce and The Lena Mae Pitt 1998 Revocab
Bought by
Duggins Doretha Mae
Purchase Details
Closed on
Jan 26, 1998
Sold by
Pitt Lena Mae
Bought by
Pitt Lena Mae
Create a Home Valuation Report for This Property
The Home Valuation Report is an in-depth analysis detailing your home's value as well as a comparison with similar homes in the area
Home Values in the Area
Average Home Value in this Area
Purchase History
| Date | Buyer | Sale Price | Title Company |
|---|---|---|---|
| Homeland Central Properties Llc | $75,000 | Old Republic Title | |
| Aynes Ted G | $68,500 | American Guaranty Title Co | |
| Duggins Doretha M | -- | -- | |
| Duggins Doretha Mae | -- | -- | |
| Pitt Lena Mae | -- | -- |
Source: Public Records
Mortgage History
| Date | Status | Borrower | Loan Amount |
|---|---|---|---|
| Open | Homeland Central Properties Llc | $62,241 |
Source: Public Records
Tax History Compared to Growth
Tax History
| Year | Tax Paid | Tax Assessment Tax Assessment Total Assessment is a certain percentage of the fair market value that is determined by local assessors to be the total taxable value of land and additions on the property. | Land | Improvement |
|---|---|---|---|---|
| 2024 | $1,274 | $11,498 | $2,055 | $9,443 |
| 2023 | $1,274 | $10,950 | $2,190 | $8,760 |
| 2022 | $1,227 | $10,429 | $1,640 | $8,789 |
| 2021 | $1,199 | $9,933 | $1,855 | $8,078 |
| 2020 | $1,106 | $9,460 | $1,972 | $7,488 |
| 2019 | $1,115 | $9,413 | $1,917 | $7,496 |
| 2018 | $1,069 | $8,965 | $0 | $0 |
| 2017 | $1,052 | $8,854 | $1,766 | $7,088 |
| 2016 | $1,023 | $8,689 | $1,766 | $6,923 |
| 2015 | $991 | $8,349 | $1,766 | $6,583 |
| 2014 | $965 | $8,181 | $1,881 | $6,300 |
Source: Public Records
Map
Nearby Homes
- 2832 SW 77th St
- 7917 S Linn Ave
- 7501 S Sherwood Ave Unit 16
- 7909 S Villa Ave
- 2821 SW 86th St
- 2612 SW 71st St
- 7125 S Linn Ave
- 8309 S Hillcrest Dr
- 2432 SW 80th St
- 3101 SW 71st St
- 2721 SW 87th St
- 7017 S Miller Ave
- 2500 SW 84th St
- 7716 S Charlotte Dr
- 3044 S Madole Blvd
- 3016 SW 68th St
- 3205 SW 86th St
- 8409 S Independence Ave
- 8620 S Hillcrest Dr
- 2424 SW 86th St
- 2813 SW 77th St
- 2821 SW 77th St
- 2809 SW 77th St
- 2825 SW 77th St
- 2824 SW Meadow Cliff Dr
- 2828 SW Meadow Cliff Dr
- 2820 SW Meadow Cliff Dr
- 2816 SW Meadow Cliff Dr
- 2832 SW Meadow Cliff Dr
- 2816 SW 77th St
- 2829 SW 77th St
- 2820 SW 77th St
- 2812 SW 77th St
- 2805 SW 77th St
- 2806 SW 77th St
- 2812 SW Meadow Cliff Dr
- 2824 SW 77th St
- 2836 SW Meadow Cliff Dr
- 2833 SW 77th St
- 2828 SW 77th St