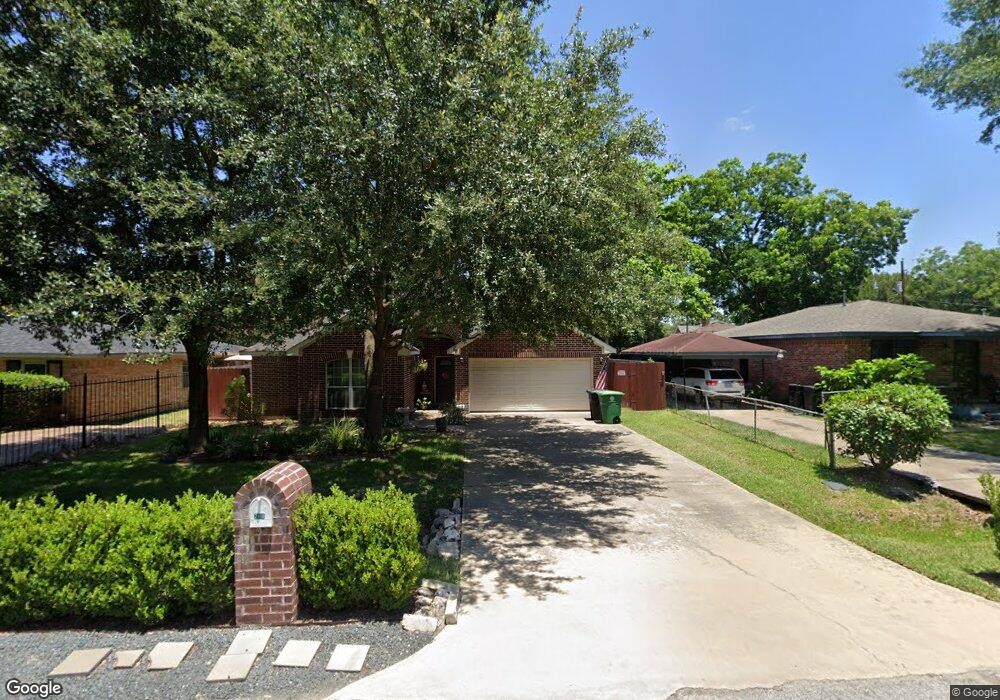
2818 Dalview St Houston, TX 77091
Acres Homes NeighborhoodEstimated Value: $259,000 - $277,000
3
Beds
2
Baths
1,835
Sq Ft
$145/Sq Ft
Est. Value
About This Home
This home is located at 2818 Dalview St, Houston, TX 77091 and is currently estimated at $266,775, approximately $145 per square foot. 2818 Dalview St is a home located in Harris County with nearby schools including Edward a Vines EC/Pre-K/K School, Harris Elementary School, and Hoffman Middle School.
Ownership History
Date
Name
Owned For
Owner Type
Purchase Details
Closed on
Sep 3, 2014
Sold by
San Luis Michael A and San Luis Claudia
Bought by
Stamos Michele M
Current Estimated Value
Home Financials for this Owner
Home Financials are based on the most recent Mortgage that was taken out on this home.
Original Mortgage
$110,000
Outstanding Balance
$84,243
Interest Rate
4.15%
Mortgage Type
New Conventional
Estimated Equity
$182,532
Purchase Details
Closed on
Sep 20, 2007
Sold by
Estrada Jesus Hermilo and Estrada Virgilia
Bought by
San Luis Michael A
Home Financials for this Owner
Home Financials are based on the most recent Mortgage that was taken out on this home.
Original Mortgage
$119,250
Interest Rate
6.66%
Mortgage Type
Purchase Money Mortgage
Purchase Details
Closed on
Apr 24, 2006
Sold by
Rashed Abdur
Bought by
Estrada Jesus Hermilo
Purchase Details
Closed on
Feb 22, 2006
Sold by
Rashed Monica
Bought by
Rashed Abdur
Create a Home Valuation Report for This Property
The Home Valuation Report is an in-depth analysis detailing your home's value as well as a comparison with similar homes in the area
Home Values in the Area
Average Home Value in this Area
Purchase History
| Date | Buyer | Sale Price | Title Company |
|---|---|---|---|
| Stamos Michele M | -- | Startex Title Co | |
| San Luis Michael A | -- | First American Title | |
| Estrada Jesus Hermilo | -- | Fidelity National Title | |
| Rashed Abdur | -- | None Available |
Source: Public Records
Mortgage History
| Date | Status | Borrower | Loan Amount |
|---|---|---|---|
| Open | Stamos Michele M | $110,000 | |
| Previous Owner | San Luis Michael A | $119,250 |
Source: Public Records
Tax History Compared to Growth
Tax History
| Year | Tax Paid | Tax Assessment Tax Assessment Total Assessment is a certain percentage of the fair market value that is determined by local assessors to be the total taxable value of land and additions on the property. | Land | Improvement |
|---|---|---|---|---|
| 2025 | $3,388 | $263,638 | $91,140 | $172,498 |
| 2024 | $3,388 | $254,600 | $91,140 | $163,460 |
| 2023 | $3,388 | $254,600 | $83,055 | $171,545 |
| 2022 | $4,307 | $229,357 | $33,075 | $196,282 |
| 2021 | $4,100 | $163,236 | $33,075 | $130,161 |
| 2020 | $4,163 | $157,718 | $33,075 | $124,643 |
| 2019 | $4,130 | $149,263 | $23,153 | $126,110 |
| 2018 | $2,009 | $164,888 | $20,948 | $143,940 |
| 2017 | $4,037 | $164,888 | $20,948 | $143,940 |
| 2016 | $3,670 | $138,359 | $18,743 | $119,616 |
| 2015 | $2,381 | $138,359 | $18,743 | $119,616 |
| 2014 | $2,381 | $123,544 | $14,700 | $108,844 |
Source: Public Records
Map
Nearby Homes
- 2713 Druid St
- 3110 Druid St
- 2643 Dalview St
- 2639 Dalview St
- 0 Areba St
- 2626 Druid St
- 2703 Areba St
- 2627 Carmel St
- 2622 Carmel St
- 2519 Garapan St
- 6217 Nuben St
- 2515 Garapan St
- 2604 Areba St
- 2511 Garapan St
- 2507 Garapan St
- 2478 Druid St
- 0 T C Jester Blvd Unit 62962419
- 3211 De Soto St
- 5505 T C Jester Blvd
- 6413 T C Jester Blvd
- 2818 Dalview St
- 2814 Dalview St
- 2822 Dalview St
- 2810 Dalview St
- 2903 Cliffdale St
- 2907 Cliffdale St
- 2899 Cliffdale St
- 2911 Cliffdale St
- 2914 Dalview St
- 2895 Cliffdale St
- 2815 Dalview St
- 2911 Dalview St
- 6523 Nuben St
- 2915 Cliffdale St
- 3002 Dalview St
- 6535 Nuben St
- 3003 Cliffdale St
- 3006 Dalview St
- 3003 Dalview St
- 2904 Druid St