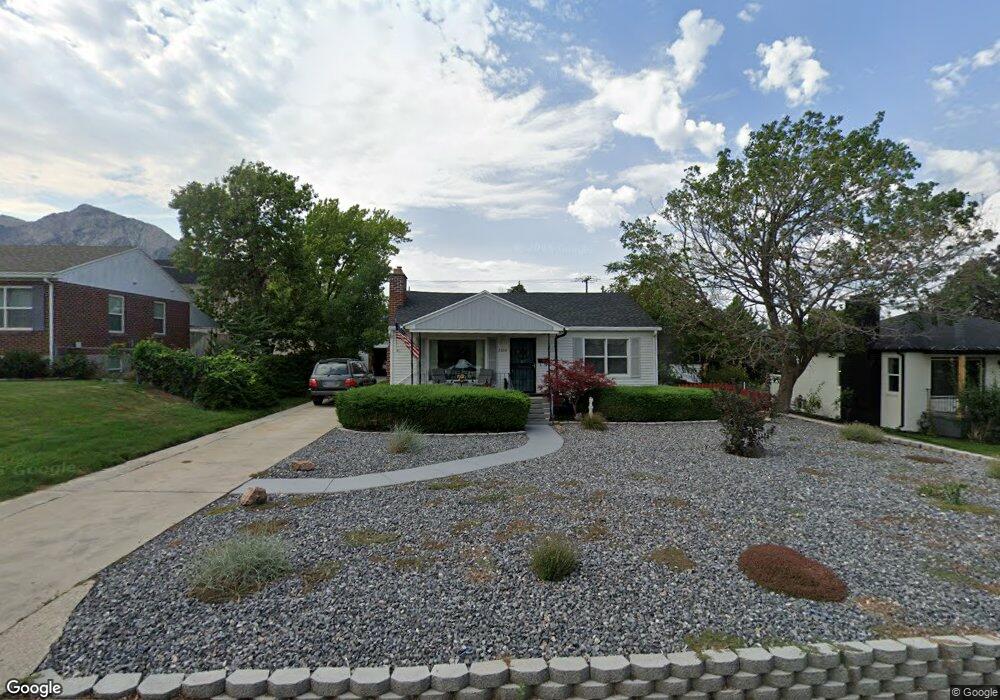
2818 E 3220 S Salt Lake City, UT 84109
Canyon Rim NeighborhoodEstimated Value: $604,000 - $703,000
4
Beds
1
Bath
868
Sq Ft
$761/Sq Ft
Est. Value
About This Home
This home is located at 2818 E 3220 S, Salt Lake City, UT 84109 and is currently estimated at $660,336, approximately $760 per square foot. 2818 E 3220 S is a home located in Salt Lake County with nearby schools including Morningside School, Wasatch Junior High School, and Skyline High School.
Ownership History
Date
Name
Owned For
Owner Type
Purchase Details
Closed on
May 23, 2003
Sold by
Christensen Lynn J and Christensen Shirley D
Bought by
Christensen Lynn J and Christensen Shirley D
Current Estimated Value
Home Financials for this Owner
Home Financials are based on the most recent Mortgage that was taken out on this home.
Original Mortgage
$89,000
Interest Rate
5.75%
Mortgage Type
Purchase Money Mortgage
Purchase Details
Closed on
Aug 27, 2002
Sold by
Christensen Lynn J and Christensen Shirley D
Bought by
Christensen Lynn J and Christensen Shirley D
Create a Home Valuation Report for This Property
The Home Valuation Report is an in-depth analysis detailing your home's value as well as a comparison with similar homes in the area
Home Values in the Area
Average Home Value in this Area
Purchase History
| Date | Buyer | Sale Price | Title Company |
|---|---|---|---|
| Christensen Lynn J | -- | Guardian Title | |
| Christensen Lynn J | -- | Guardian Title | |
| Christensen Lynn J | -- | -- |
Source: Public Records
Mortgage History
| Date | Status | Borrower | Loan Amount |
|---|---|---|---|
| Closed | Christensen Lynn J | $89,000 |
Source: Public Records
Tax History Compared to Growth
Tax History
| Year | Tax Paid | Tax Assessment Tax Assessment Total Assessment is a certain percentage of the fair market value that is determined by local assessors to be the total taxable value of land and additions on the property. | Land | Improvement |
|---|---|---|---|---|
| 2025 | $3,325 | $569,800 | $297,200 | $272,600 |
| 2024 | $3,325 | $532,300 | $288,000 | $244,300 |
| 2023 | $3,202 | $494,900 | $240,000 | $254,900 |
| 2022 | $3,100 | $481,600 | $235,300 | $246,300 |
| 2021 | $3,055 | $397,100 | $181,000 | $216,100 |
| 2020 | $2,760 | $350,900 | $175,000 | $175,900 |
| 2019 | $2,631 | $326,800 | $164,900 | $161,900 |
| 2018 | $2,494 | $298,300 | $164,900 | $133,400 |
| 2017 | $2,340 | $293,200 | $164,900 | $128,300 |
| 2016 | $2,288 | $289,500 | $164,900 | $124,600 |
| 2015 | $2,327 | $275,500 | $171,500 | $104,000 |
| 2014 | $2,173 | $251,700 | $160,000 | $91,700 |
Source: Public Records
Map
Nearby Homes
- 2776 E 3220 S
- 2961 E Marley Place
- 2596 E Gregson Ave
- 3156 E Elgin Dr
- 2963 S Grace St
- 3420 S Pioneer St
- 9556 E 2655 S Unit 34
- 9556 E 2655 S Unit 35
- 3245 E Cummings Rd
- 3123 S 2300 E
- 3094 S 2300 E
- 3295 E Cummings Rd
- 3685 S Craig Cir
- 3096 S 2300 E Unit 2
- 2835 S 2475 E
- 2341 E Neffs Ln
- 2193 E Lambourne Ave Unit 3
- 3801 S 2700 E
- 2150 E 3205 S
- 2311 E Delia Dr