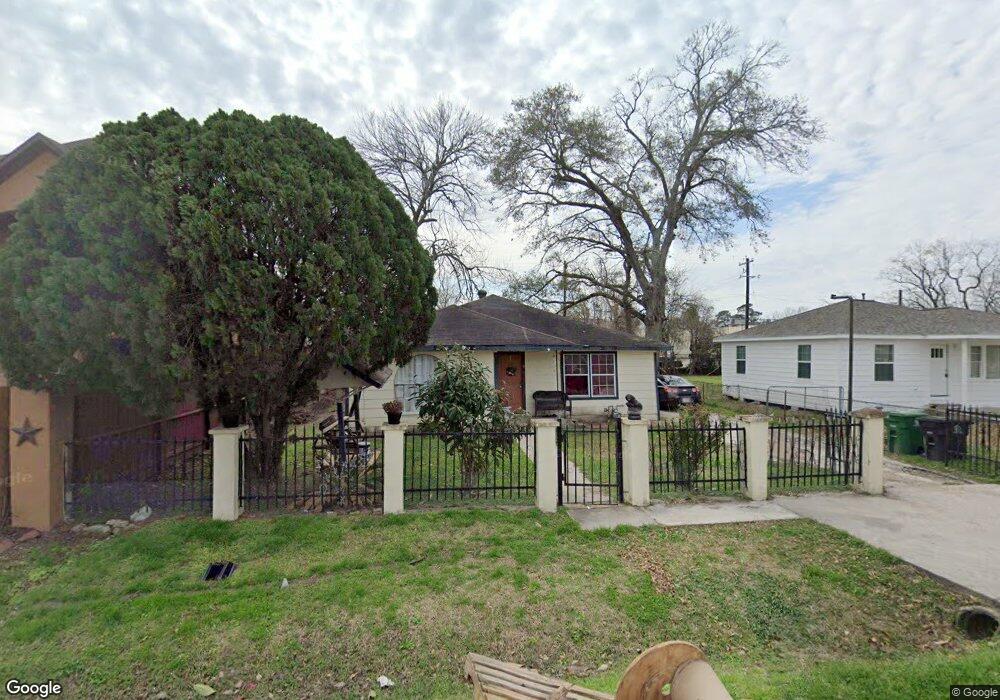
2818 Hitchcock St Houston, TX 77093
Eastex-Jensen NeighborhoodEstimated Value: $152,674 - $182,000
2
Beds
1
Bath
1,016
Sq Ft
$166/Sq Ft
Est. Value
About This Home
This home is located at 2818 Hitchcock St, Houston, TX 77093 and is currently estimated at $168,419, approximately $165 per square foot. 2818 Hitchcock St is a home located in Harris County with nearby schools including Coop Elementary School, Patrick Henry Middle School, and Sam Houston Math, Science & Technology Center.
Ownership History
Date
Name
Owned For
Owner Type
Purchase Details
Closed on
Feb 10, 2009
Sold by
Vistamont Management Inc
Bought by
Gutierrez Jesus E and Lopez Idalia
Current Estimated Value
Purchase Details
Closed on
Oct 16, 2008
Sold by
Wells Fargo Bank Na
Bought by
Vistamont Management Inc
Purchase Details
Closed on
Jul 1, 2008
Sold by
Munoz Mauro and Munoz Maria
Bought by
Wells Fargo Bank Na and Asset Backed Pass Through Certificates S
Purchase Details
Closed on
May 17, 1996
Sold by
Oharia Ashok R
Bought by
Munoz Mauro and Munoz Alejandro
Home Financials for this Owner
Home Financials are based on the most recent Mortgage that was taken out on this home.
Original Mortgage
$110,000
Interest Rate
7.74%
Mortgage Type
Seller Take Back
Create a Home Valuation Report for This Property
The Home Valuation Report is an in-depth analysis detailing your home's value as well as a comparison with similar homes in the area
Home Values in the Area
Average Home Value in this Area
Purchase History
| Date | Buyer | Sale Price | Title Company |
|---|---|---|---|
| Gutierrez Jesus E | -- | None Available | |
| Vistamont Management Inc | -- | None Available | |
| Wells Fargo Bank Na | $48,484 | None Available | |
| Munoz Mauro | -- | -- |
Source: Public Records
Mortgage History
| Date | Status | Borrower | Loan Amount |
|---|---|---|---|
| Previous Owner | Munoz Mauro | $110,000 | |
| Closed | Gutierrez Jesus E | $0 |
Source: Public Records
Tax History Compared to Growth
Tax History
| Year | Tax Paid | Tax Assessment Tax Assessment Total Assessment is a certain percentage of the fair market value that is determined by local assessors to be the total taxable value of land and additions on the property. | Land | Improvement |
|---|---|---|---|---|
| 2025 | $3,327 | $186,527 | $62,605 | $123,922 |
| 2024 | $3,327 | $159,012 | $54,780 | $104,232 |
| 2023 | $3,327 | $174,301 | $52,171 | $122,130 |
| 2022 | $3,059 | $138,912 | $37,265 | $101,647 |
| 2021 | $2,657 | $114,005 | $26,086 | $87,919 |
| 2020 | $2,018 | $83,327 | $26,086 | $57,241 |
| 2019 | $2,109 | $83,327 | $26,086 | $57,241 |
| 2018 | $1,574 | $62,201 | $17,887 | $44,314 |
| 2017 | $1,573 | $62,201 | $17,887 | $44,314 |
| 2016 | $1,573 | $62,201 | $17,887 | $44,314 |
| 2015 | $1,434 | $55,787 | $15,651 | $40,136 |
| 2014 | $1,434 | $55,787 | $15,651 | $40,136 |
Source: Public Records
Map
Nearby Homes
- 2633 Hollis St
- 3202 Parker Rd
- 2919 La Estancia Ln
- 3302 Sparks St
- 3614 Tidwell Rd
- 3110 Tidwell Rd
- 2318 Cresline St
- 3709 Gager St
- 3806 Hage St
- 2415 Goodloe St
- 3807 Hage St
- 9634 Burden St
- 9630 Burden St
- 2332 Margaret St
- 3809 Turner Dr
- 8418 Jensen Dr
- 0.0 Friendly Rd
- 9009 Ramin Dr
- 4918 Langley Rd
- 3810 Hurley St
- 2818 Hitchcock St
- 2814 Hitchcock St
- 2822 Hitchcock St
- 2806 Hitchcock St
- 2910 Hitchcock St
- 2819 Hitchcock St
- 2903 Hitchcock St
- 2815 Hitchcock St
- 2907 Hitchcock St
- 2811 Hitchcock St
- 2802 Hitchcock St
- 2914 Hitchcock St
- 2911 Hitchcock St
- 2807 Hitchcock St
- 2915 Hitchcock St
- 2718 Hitchcock St
- 2918 Hitchcock St
- 2803 Hitchcock St
- 2818 Folger St
- 2902 Folger St