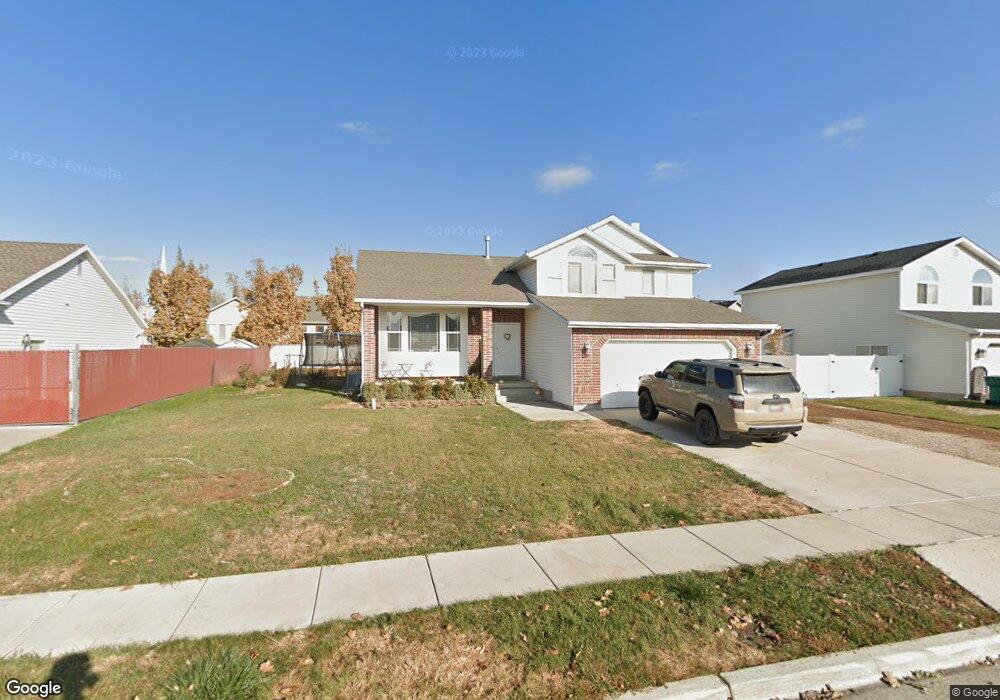
2818 W 1475 N Layton, UT 84041
Estimated Value: $497,774 - $530,000
4
Beds
3
Baths
2,329
Sq Ft
$220/Sq Ft
Est. Value
About This Home
This home is located at 2818 W 1475 N, Layton, UT 84041 and is currently estimated at $512,444, approximately $220 per square foot. 2818 W 1475 N is a home located in Davis County with nearby schools including Legacy Junior High School, Layton High School, and North Davis Preparatory Academy.
Ownership History
Date
Name
Owned For
Owner Type
Purchase Details
Closed on
Nov 28, 2005
Sold by
Spencer Jesse and Spencer Susan
Bought by
Feuinng Bernell L and Feuling Mardel C
Current Estimated Value
Purchase Details
Closed on
Mar 28, 2003
Sold by
Loveland Casey S and Loveland Amy H
Bought by
Spencer Jesse and Spencer Susan
Home Financials for this Owner
Home Financials are based on the most recent Mortgage that was taken out on this home.
Original Mortgage
$151,050
Interest Rate
8.75%
Purchase Details
Closed on
Feb 25, 1999
Sold by
Glauser Lynn and Glauser Sandi
Bought by
Loveland Casey S and Loveland Amy H
Home Financials for this Owner
Home Financials are based on the most recent Mortgage that was taken out on this home.
Original Mortgage
$136,300
Interest Rate
6.78%
Purchase Details
Closed on
Sep 21, 1998
Sold by
Sierra Pacific Homes
Bought by
Leseberg Richard P and Leseberg Natalie J
Home Financials for this Owner
Home Financials are based on the most recent Mortgage that was taken out on this home.
Original Mortgage
$140,658
Interest Rate
6.89%
Mortgage Type
VA
Create a Home Valuation Report for This Property
The Home Valuation Report is an in-depth analysis detailing your home's value as well as a comparison with similar homes in the area
Home Values in the Area
Average Home Value in this Area
Purchase History
| Date | Buyer | Sale Price | Title Company |
|---|---|---|---|
| Feuinng Bernell L | -- | Bonneville Title Company | |
| Spencer Jesse | -- | Heritage West Title Insuranc | |
| Loveland Casey S | -- | Security Title Company | |
| Leseberg Richard P | -- | U S Title |
Source: Public Records
Mortgage History
| Date | Status | Borrower | Loan Amount |
|---|---|---|---|
| Previous Owner | Spencer Jesse | $151,050 | |
| Previous Owner | Loveland Casey S | $136,300 | |
| Previous Owner | Leseberg Richard P | $140,658 |
Source: Public Records
Tax History Compared to Growth
Tax History
| Year | Tax Paid | Tax Assessment Tax Assessment Total Assessment is a certain percentage of the fair market value that is determined by local assessors to be the total taxable value of land and additions on the property. | Land | Improvement |
|---|---|---|---|---|
| 2025 | $2,416 | $253,551 | $106,211 | $147,340 |
| 2024 | $2,341 | $247,499 | $118,446 | $129,053 |
| 2023 | $2,216 | $227,150 | $63,411 | $163,738 |
| 2022 | $2,418 | $445,000 | $133,439 | $311,561 |
| 2021 | $2,193 | $331,000 | $110,122 | $220,878 |
| 2020 | $1,975 | $286,000 | $92,264 | $193,736 |
| 2019 | $1,911 | $271,000 | $95,783 | $175,217 |
| 2018 | $1,833 | $261,000 | $83,884 | $177,116 |
| 2016 | $1,602 | $117,700 | $32,390 | $85,310 |
| 2015 | $1,605 | $111,925 | $32,390 | $79,535 |
| 2014 | $1,582 | $112,831 | $32,390 | $80,441 |
| 2013 | -- | $106,916 | $28,952 | $77,964 |
Source: Public Records
Map
Nearby Homes