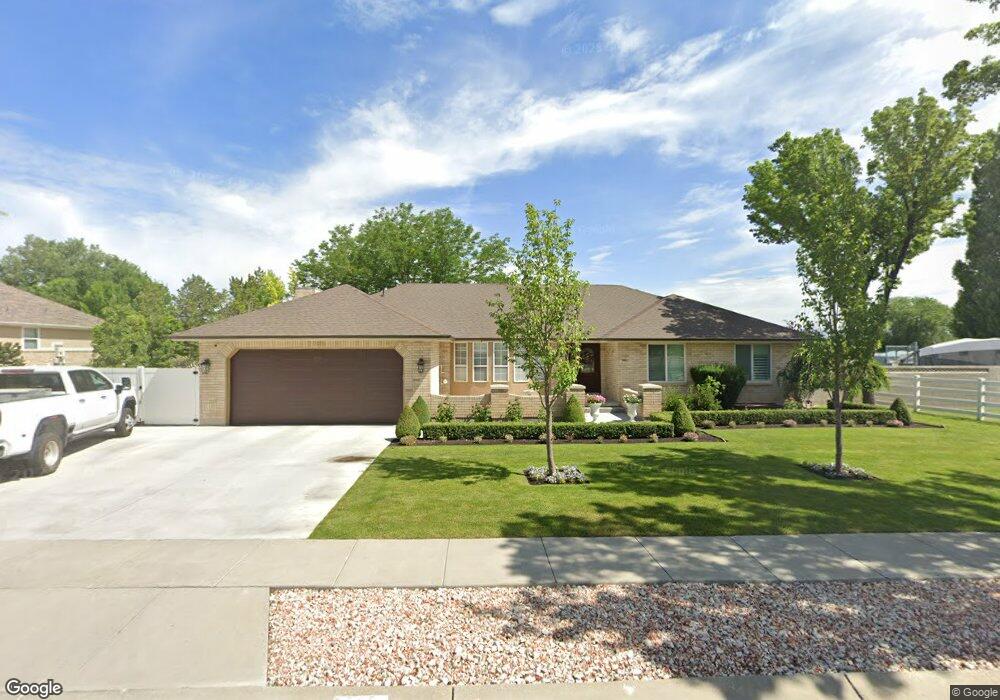
2818 W 9435 S South Jordan, UT 84095
Estimated Value: $899,000 - $1,031,000
5
Beds
4
Baths
4,480
Sq Ft
$217/Sq Ft
Est. Value
About This Home
This home is located at 2818 W 9435 S, South Jordan, UT 84095 and is currently estimated at $973,817, approximately $217 per square foot. 2818 W 9435 S is a home located in Salt Lake County with nearby schools including Jordan Ridge School, South Jordan Middle School, and Hawthorn Academy.
Ownership History
Date
Name
Owned For
Owner Type
Purchase Details
Closed on
Jan 28, 2022
Sold by
Romero Islas Paulino
Bought by
Islas Paulino Romero and Ortega Maria Isabel
Current Estimated Value
Home Financials for this Owner
Home Financials are based on the most recent Mortgage that was taken out on this home.
Original Mortgage
$675,000
Interest Rate
3.56%
Mortgage Type
New Conventional
Purchase Details
Closed on
Feb 11, 2013
Sold by
Fleming Drew S and Fleming Lorrie I
Bought by
Fleming Lorrie J
Home Financials for this Owner
Home Financials are based on the most recent Mortgage that was taken out on this home.
Original Mortgage
$227,000
Interest Rate
3.29%
Mortgage Type
New Conventional
Create a Home Valuation Report for This Property
The Home Valuation Report is an in-depth analysis detailing your home's value as well as a comparison with similar homes in the area
Home Values in the Area
Average Home Value in this Area
Purchase History
| Date | Buyer | Sale Price | Title Company |
|---|---|---|---|
| Islas Paulino Romero | -- | Novation Title Insurance Agenc | |
| Islas Paulino Romero | -- | First American Title | |
| Fleming Lorrie J | -- | Sutherland Title | |
| Fleming Lorrie J | -- | Sutherland Title |
Source: Public Records
Mortgage History
| Date | Status | Borrower | Loan Amount |
|---|---|---|---|
| Closed | Islas Paulino Romero | $675,000 | |
| Previous Owner | Fleming Lorrie J | $227,000 |
Source: Public Records
Tax History Compared to Growth
Tax History
| Year | Tax Paid | Tax Assessment Tax Assessment Total Assessment is a certain percentage of the fair market value that is determined by local assessors to be the total taxable value of land and additions on the property. | Land | Improvement |
|---|---|---|---|---|
| 2025 | $4,724 | $965,800 | $253,200 | $712,600 |
| 2024 | $4,724 | $897,000 | $235,000 | $662,000 |
| 2023 | $4,907 | $879,100 | $228,200 | $650,900 |
| 2022 | $4,761 | $836,000 | $223,700 | $612,300 |
| 2021 | $3,939 | $634,600 | $170,900 | $463,700 |
| 2020 | $3,755 | $567,000 | $165,400 | $401,600 |
| 2019 | $3,755 | $557,300 | $165,400 | $391,900 |
| 2018 | $3,516 | $519,300 | $165,400 | $353,900 |
| 2017 | $3,398 | $491,900 | $135,300 | $356,600 |
| 2016 | $3,463 | $475,000 | $135,300 | $339,700 |
| 2015 | $3,296 | $439,500 | $137,800 | $301,700 |
| 2014 | $3,068 | $402,100 | $127,500 | $274,600 |
Source: Public Records
Map
Nearby Homes
- 1967 W 9350 S
- 9294 S 2700 W
- 2883 Jana Lee Dr
- 9178 Lisa Ave
- 2636 W 9110 S
- 3256 Star Fire Rd
- 2286 Williamsburg Cir
- 2551 W Winding Way
- 2223 W Williamsburg Cir
- 8886 S 2700 W
- 2177 W 9240 S
- 2970 W 8870 S
- 2116 W Abbey View Rd
- 2097 Jordan Villa Dr
- 2246 Country Bend Dr Unit 25
- 9252 S 2040 W Unit D
- 2439 Bridle Oak Dr
- 9414 S 1980 W
- 3214 W Monterey Pine Ln
- 9526 Ember Glow Ct Unit C