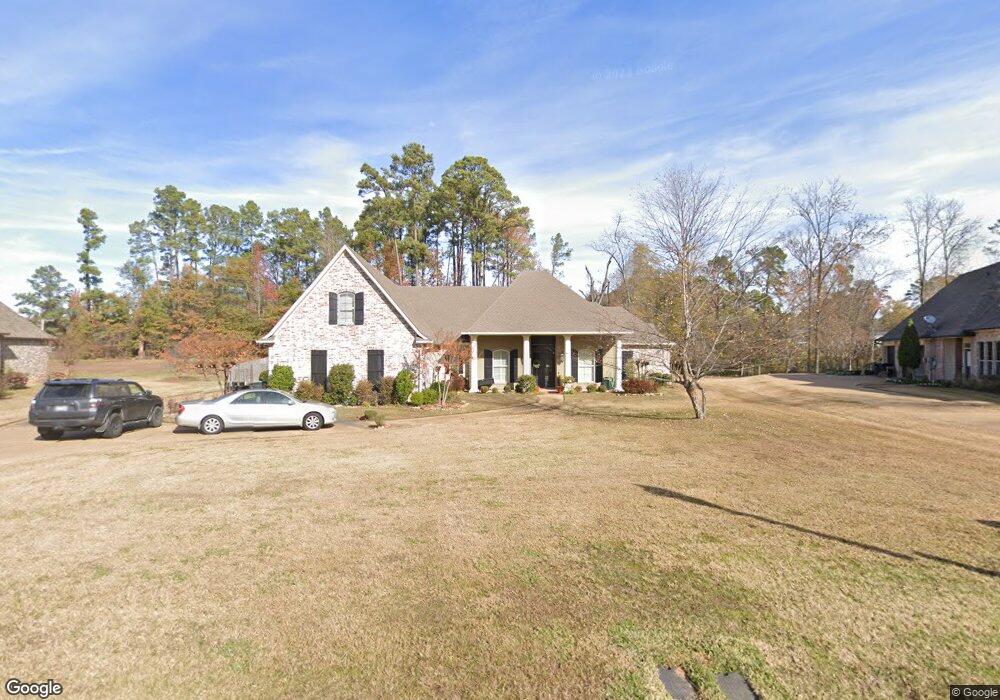
2819 Falmoth Dr Shreveport, LA 71106
Ellerbe Woods NeighborhoodEstimated Value: $670,000 - $803,000
4
Beds
3
Baths
3,851
Sq Ft
$188/Sq Ft
Est. Value
About This Home
This home is located at 2819 Falmoth Dr, Shreveport, LA 71106 and is currently estimated at $723,997, approximately $188 per square foot. 2819 Falmoth Dr is a home located in Caddo Parish with nearby schools including Fairfield Magnet School, Judson Fundamental Elementary School, and Eden Gardens Fundamental Elementary School.
Ownership History
Date
Name
Owned For
Owner Type
Purchase Details
Closed on
May 10, 2010
Sold by
Blad Thomas M and Blad Patricia F
Bought by
Brossett Larry Wayne and Brossett Sue Heinsohn
Current Estimated Value
Home Financials for this Owner
Home Financials are based on the most recent Mortgage that was taken out on this home.
Original Mortgage
$417,000
Interest Rate
4.81%
Mortgage Type
New Conventional
Purchase Details
Closed on
Sep 5, 2007
Sold by
Tommy R Smith Builders Inc
Bought by
Blad Thomas M and Blad Patricia F
Home Financials for this Owner
Home Financials are based on the most recent Mortgage that was taken out on this home.
Original Mortgage
$390,000
Interest Rate
6.63%
Mortgage Type
New Conventional
Purchase Details
Closed on
Mar 1, 2007
Sold by
Juniper Builders Inc
Bought by
Tommy R Smith Builders Inc
Create a Home Valuation Report for This Property
The Home Valuation Report is an in-depth analysis detailing your home's value as well as a comparison with similar homes in the area
Home Values in the Area
Average Home Value in this Area
Purchase History
| Date | Buyer | Sale Price | Title Company |
|---|---|---|---|
| Brossett Larry Wayne | $550,000 | None Available | |
| Blad Thomas M | $538,283 | None Available | |
| Tommy R Smith Builders Inc | $55,000 | None Available |
Source: Public Records
Mortgage History
| Date | Status | Borrower | Loan Amount |
|---|---|---|---|
| Previous Owner | Brossett Larry Wayne | $417,000 | |
| Previous Owner | Blad Thomas M | $390,000 |
Source: Public Records
Tax History Compared to Growth
Tax History
| Year | Tax Paid | Tax Assessment Tax Assessment Total Assessment is a certain percentage of the fair market value that is determined by local assessors to be the total taxable value of land and additions on the property. | Land | Improvement |
|---|---|---|---|---|
| 2024 | $8,110 | $52,026 | $5,544 | $46,482 |
| 2023 | $8,292 | $52,026 | $5,544 | $46,482 |
| 2022 | $8,292 | $52,026 | $5,544 | $46,482 |
| 2021 | $8,166 | $52,026 | $5,544 | $46,482 |
| 2020 | $8,166 | $52,026 | $5,544 | $46,482 |
| 2019 | $8,414 | $52,026 | $5,736 | $46,290 |
| 2018 | $5,734 | $52,026 | $5,736 | $46,290 |
| 2017 | $8,547 | $52,026 | $5,736 | $46,290 |
| 2015 | $6,166 | $55,080 | $5,740 | $49,340 |
| 2014 | $6,213 | $55,080 | $5,740 | $49,340 |
| 2013 | -- | $55,080 | $5,740 | $49,340 |
Source: Public Records
Map
Nearby Homes
- 2716 Stone Creek Dr
- 0 W Pointe Dr Unit 368 20773522
- 0 W Pointe Dr Unit 367 20773513
- 0 W Pointe Dr Unit 372 20744840
- 0 W Pointe Dr Unit 370 20561898
- 1260 Capilano Dr
- 9028 Hayden Dr
- 9036 Hayden Dr
- 9040 Hayden Dr
- 0 W Pointe Loop Unit 359 20773325
- 0 W Pointe Loop Unit 389 20744841
- 0 W Pointe Loop Unit 364 20744838
- 0 W Pointe Loop Unit 363 20744837
- 0 W Pointe Loop Unit 360 20744835
- 0 W Pointe Loop Unit 366 20744826
- 0 W Pointe Loop Unit 346 20744825
- 0 W Pointe Loop Unit 345 20744822
- 0 W Pointe Loop Unit 20695150
- 10489 Plum Creek Dr
- 390 Newburn Ln
- 2815 Falmoth Dr
- 2823 Falmoth Dr
- 2811 Falmoth Dr
- 2820 Falmoth Dr
- 2707 Stone Creek Dr
- 2810 Falmoth Dr
- 2711 Stone Creek Dr
- 2807 Falmoth Dr
- 2824 Falmoth Dr
- 2715 Stone Creek Dr
- 2806 Falmoth Dr
- 2912 Long Lake Dr
- 2828 Falmoth Dr
- 2719 Stone Creek Dr
- 2812 Tuscany Cir
- 2812 Tuscany Cir
- 2910 Long Lake Dr
- 2704 Stone Creek Dr
- 2808 Tuscany Cir
- 2802 Falmoth Dr