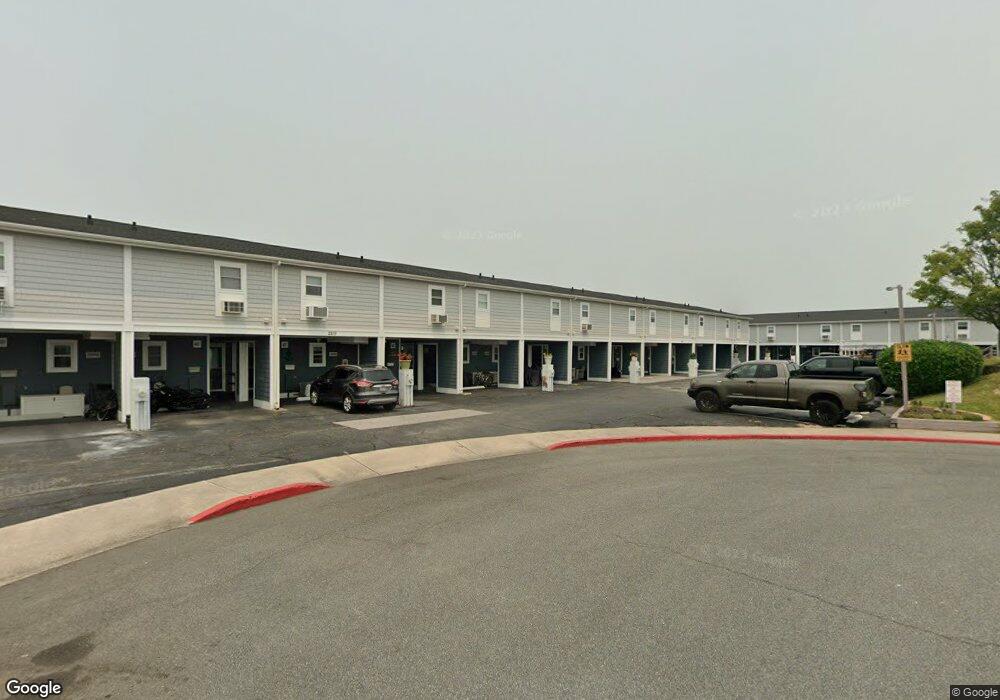
2819 Plover Dr Unit 1603 Ocean City, MD 21842
Estimated Value: $332,133 - $377,000
--
Bed
1
Bath
1,002
Sq Ft
$345/Sq Ft
Est. Value
About This Home
This home is located at 2819 Plover Dr Unit 1603, Ocean City, MD 21842 and is currently estimated at $345,783, approximately $345 per square foot. 2819 Plover Dr Unit 1603 is a home located in Worcester County with nearby schools including Ocean City Elementary School, Stephen Decatur Middle School, and Berlin Intermediate School.
Ownership History
Date
Name
Owned For
Owner Type
Purchase Details
Closed on
Feb 5, 2015
Sold by
Shellenberger Sandra L and Shellenberger Amber J
Bought by
Mcfadden Alaina
Current Estimated Value
Home Financials for this Owner
Home Financials are based on the most recent Mortgage that was taken out on this home.
Original Mortgage
$112,500
Outstanding Balance
$85,783
Interest Rate
3.64%
Mortgage Type
New Conventional
Estimated Equity
$260,000
Purchase Details
Closed on
May 7, 2002
Sold by
Ann Shue William Edward and Ann Phyllis
Bought by
Shellenberger Donald E and Shellenberger Sandra
Purchase Details
Closed on
Jan 9, 1987
Sold by
Ward Linwood F and Ward Betty
Bought by
Shue William Edward and Phyllis Ann
Purchase Details
Closed on
Apr 7, 1981
Sold by
Bay Shore Development
Bought by
Ward Linwood F and Ward Betty
Home Financials for this Owner
Home Financials are based on the most recent Mortgage that was taken out on this home.
Original Mortgage
$32,925
Interest Rate
15.4%
Create a Home Valuation Report for This Property
The Home Valuation Report is an in-depth analysis detailing your home's value as well as a comparison with similar homes in the area
Home Values in the Area
Average Home Value in this Area
Purchase History
| Date | Buyer | Sale Price | Title Company |
|---|---|---|---|
| Mcfadden Alaina | $150,000 | None Available | |
| Shellenberger Donald E | $135,000 | -- | |
| Shue William Edward | $65,000 | -- | |
| Ward Linwood F | $43,900 | -- |
Source: Public Records
Mortgage History
| Date | Status | Borrower | Loan Amount |
|---|---|---|---|
| Open | Mcfadden Alaina | $112,500 | |
| Previous Owner | Ward Linwood F | $32,925 | |
| Closed | Shellenberger Donald E | -- |
Source: Public Records
Tax History Compared to Growth
Tax History
| Year | Tax Paid | Tax Assessment Tax Assessment Total Assessment is a certain percentage of the fair market value that is determined by local assessors to be the total taxable value of land and additions on the property. | Land | Improvement |
|---|---|---|---|---|
| 2025 | $2,987 | $256,767 | $0 | $0 |
| 2024 | $2,987 | $214,033 | $0 | $0 |
| 2023 | $2,407 | $171,300 | $85,600 | $85,700 |
| 2022 | $2,407 | $171,300 | $85,600 | $85,700 |
| 2021 | $2,421 | $171,300 | $85,600 | $85,700 |
| 2020 | $2,420 | $171,300 | $85,600 | $85,700 |
| 2019 | $2,385 | $167,633 | $0 | $0 |
| 2018 | $2,309 | $163,967 | $0 | $0 |
| 2017 | $2,264 | $160,300 | $0 | $0 |
| 2016 | -- | $160,300 | $0 | $0 |
| 2015 | $2,188 | $160,300 | $0 | $0 |
| 2014 | $2,188 | $160,300 | $0 | $0 |
Source: Public Records
Map
Nearby Homes
- 510 Penguin Dr Unit 302B
- 2838 Gull Way
- 500 32nd St Unit A
- 608 Bayshore Ct
- 607 Bayshore Dr Unit 2
- 2802 Tern Dr Unit 17
- 2807D Plover Dr Unit 4
- 2803 Gull Way Unit B01
- 607 Osprey Rd Unit 4
- 617 Bayshore Ct Unit B
- 504 Robin Dr Unit 69
- 512 Robin Dr Unit 7
- 504 Robin Dr Unit 50
- 504 Robin Dr Unit 70
- 508 Robin Dr Unit 44
- 512 Robin Dr Unit 14
- 508 Robin Dr Unit 47
- 508 Robin Dr Unit 42
- 424 Lark Ln
- 424 Lark Ln
- 2819 Plover Dr Unit 15
- 2819 Plover Dr Unit 26
- 2819 Plover Dr Unit 39
- 2819 Plover Dr Unit 48
- 2819 Plover Dr Unit 4605
- 2819 Plover Dr Unit 2203
- 2819 Plover Dr Unit 2504
- 2819 Plover Dr Unit 1A1
- 2819 Plover Dr Unit 11A1
- 2819 Plover Dr Unit 3004
- 2819 Plover Dr Unit 2404
- 2819 Plover Dr Unit 3404
- 2819 Plover Dr Unit 1403
- 2819 Plover Dr Unit 4105
- 2819 Plover Dr Unit 1803
- 2819 Plover Dr Unit 3905
- 2819 Plover Dr Unit 4905
- 2819 Plover Dr Unit 1903
- 2819 Plover Dr Unit 7A1
- 2819 Plover Dr Unit 4A1