Estimated Value: $422,329 - $476,000
4
Beds
2
Baths
1,554
Sq Ft
$293/Sq Ft
Est. Value
About This Home
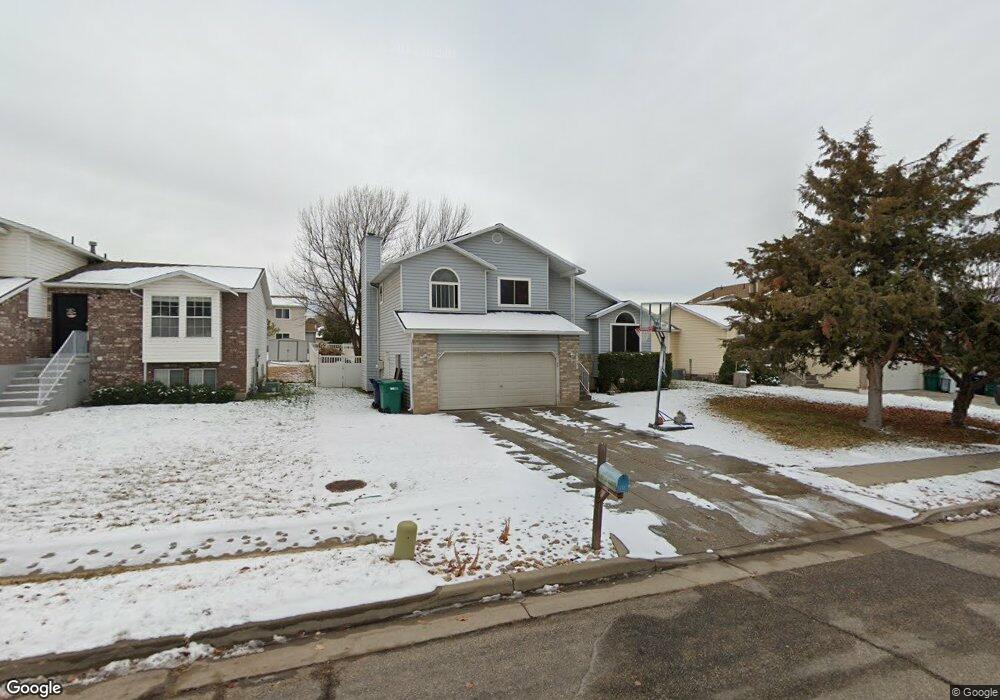
This home is located at 2819 W 4400 S, Roy, UT 84067 and is currently estimated at $454,832, approximately $292 per square foot. 2819 W 4400 S is a home located in Weber County with nearby schools including Midland School, Sand Ridge Junior High School, and Roy High School.
Create a Home Valuation Report for This Property
The Home Valuation Report is an in-depth analysis detailing your home's value as well as a comparison with similar homes in the area
Home Values in the Area
Average Home Value in this Area
Tax History
| Year | Tax Paid | Tax Assessment Tax Assessment Total Assessment is a certain percentage of the fair market value that is determined by local assessors to be the total taxable value of land and additions on the property. | Land | Improvement |
|---|---|---|---|---|
| 2025 | $2,641 | $419,050 | $130,015 | $289,035 |
| 2024 | $2,578 | $226,599 | $71,508 | $155,091 |
| 2023 | $2,380 | $208,450 | $71,317 | $137,133 |
| 2022 | $2,490 | $225,500 | $60,501 | $164,999 |
| 2021 | $2,143 | $320,000 | $75,002 | $244,998 |
| 2020 | $1,987 | $272,000 | $75,002 | $196,998 |
| 2019 | $1,932 | $249,000 | $44,976 | $204,024 |
| 2018 | $1,788 | $216,000 | $44,976 | $171,024 |
| 2017 | $1,729 | $196,000 | $43,029 | $152,971 |
| 2016 | $1,631 | $99,121 | $24,773 | $74,348 |
| 2015 | $1,492 | $92,478 | $24,773 | $67,705 |
| 2014 | $1,457 | $89,119 | $24,773 | $64,346 |
Source: Public Records
Map
Nearby Homes
- 2815 W 4275 S
- 4374 S 2900 W
- 4270 S 2900 W
- 4297 Westlake Dr
- 2979 W 4275 S
- 2778 W 4175 S Unit 237
- 2953 W 4650 S
- 2602 W 4600 S
- 4732 S West Park Dr
- 3022 W 4750 S
- 4248 S 2400 W
- 4793 S 3025 W
- 3931 S 2950 W
- 4435 Cross Creek Rd Unit 29C
- 4891 S 2875 W
- 4510 Stone Creek Rd Unit F
- 4324 S 3350 W
- 4491 Haven Creek Rd Unit A
- 4317 S 3350 W
- 4322 S 3450 W
Your Personal Tour Guide
Ask me questions while you tour the home.