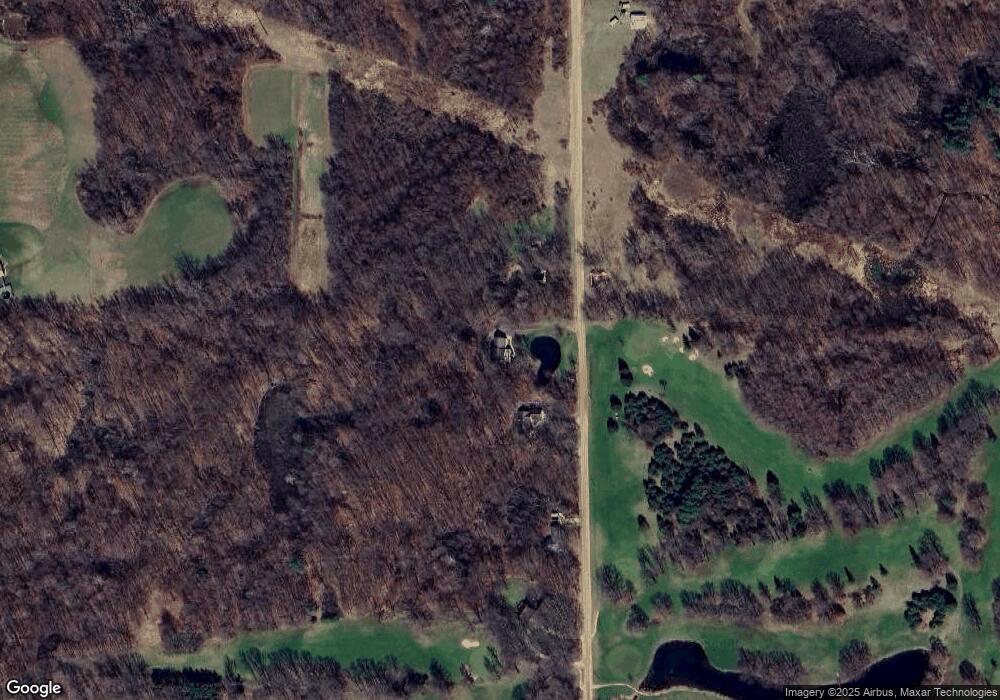
282 39th St Allegan, MI 49010
Estimated Value: $333,000 - $516,000
--
Bed
3
Baths
2,354
Sq Ft
$176/Sq Ft
Est. Value
About This Home
This home is located at 282 39th St, Allegan, MI 49010 and is currently estimated at $415,304, approximately $176 per square foot. 282 39th St is a home located in Allegan County with nearby schools including Pine Trails Elementary School, L.E. White Middle School, and Allegan High School.
Ownership History
Date
Name
Owned For
Owner Type
Purchase Details
Closed on
Jan 12, 2022
Sold by
Rhoades Gary G and Rhoades Barbara A
Bought by
Rhoades Family Trust
Current Estimated Value
Purchase Details
Closed on
May 15, 2009
Sold by
Firstbank West Michigan
Bought by
Rhoades Ryan J and Rhoades Traci D
Purchase Details
Closed on
Mar 28, 2007
Sold by
Townsend Builders Llc
Bought by
Rhoades Gary G and Rhoades Barbara A
Home Financials for this Owner
Home Financials are based on the most recent Mortgage that was taken out on this home.
Original Mortgage
$202,400
Interest Rate
6.31%
Mortgage Type
Purchase Money Mortgage
Purchase Details
Closed on
Oct 13, 2005
Sold by
Townsend Chance and Townsend Lori
Bought by
Townsend Builders Llc
Purchase Details
Closed on
Jun 8, 2005
Sold by
Allegan County 4-H Club Inc
Bought by
Townsend Chance and Townsend Builders
Create a Home Valuation Report for This Property
The Home Valuation Report is an in-depth analysis detailing your home's value as well as a comparison with similar homes in the area
Home Values in the Area
Average Home Value in this Area
Purchase History
| Date | Buyer | Sale Price | Title Company |
|---|---|---|---|
| Rhoades Family Trust | -- | None Listed On Document | |
| Rhoades Family Trust | -- | None Listed On Document | |
| Rhoades Ryan J | $20,500 | None Available | |
| Rhoades Gary G | $253,000 | 1St Amer | |
| Townsend Builders Llc | -- | -- | |
| Townsend Chance | $22,000 | Chicago Title |
Source: Public Records
Mortgage History
| Date | Status | Borrower | Loan Amount |
|---|---|---|---|
| Previous Owner | Rhoades Gary G | $202,400 |
Source: Public Records
Tax History Compared to Growth
Tax History
| Year | Tax Paid | Tax Assessment Tax Assessment Total Assessment is a certain percentage of the fair market value that is determined by local assessors to be the total taxable value of land and additions on the property. | Land | Improvement |
|---|---|---|---|---|
| 2025 | $4,062 | $216,300 | $17,000 | $199,300 |
| 2024 | -- | $186,700 | $15,000 | $171,700 |
| 2023 | $2,343 | $159,500 | $12,800 | $146,700 |
| 2022 | $2,343 | $147,200 | $11,600 | $135,600 |
| 2021 | $2,343 | $132,700 | $10,800 | $121,900 |
| 2020 | $2,343 | $125,000 | $19,200 | $105,800 |
| 2019 | $0 | $118,900 | $19,200 | $99,700 |
| 2018 | $0 | $115,800 | $20,500 | $95,300 |
| 2017 | $0 | $110,500 | $18,100 | $92,400 |
| 2016 | $0 | $94,700 | $15,300 | $79,400 |
| 2015 | -- | $94,700 | $94,700 | $0 |
| 2014 | -- | $93,500 | $0 | $0 |
| 2013 | -- | $90,700 | $14,200 | $76,500 |
Source: Public Records
Map
Nearby Homes