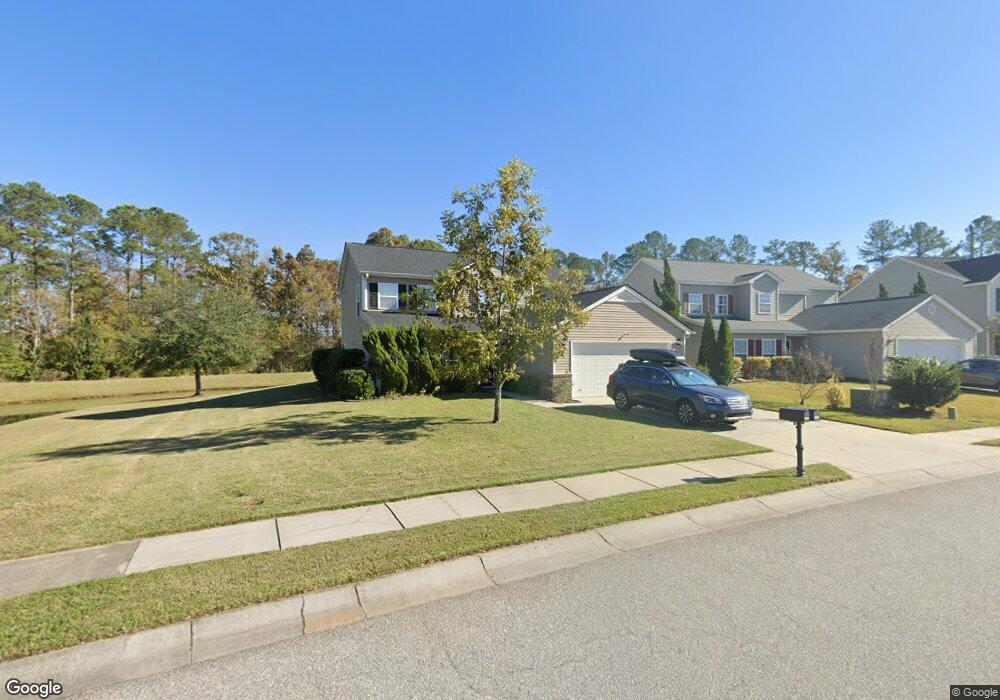
282 Clayburne Dr Goose Creek, SC 29445
Estimated Value: $381,000 - $425,000
4
Beds
4
Baths
2,464
Sq Ft
$163/Sq Ft
Est. Value
About This Home
This home is located at 282 Clayburne Dr, Goose Creek, SC 29445 and is currently estimated at $400,529, approximately $162 per square foot. 282 Clayburne Dr is a home located in Berkeley County with nearby schools including Mount Holly Elementary, Sedgefield Middle School, and Goose Creek High School.
Ownership History
Date
Name
Owned For
Owner Type
Purchase Details
Closed on
May 2, 2025
Sold by
Wightman Paul R
Bought by
Paul And Mary Wightman Living Trust and Wightman
Current Estimated Value
Purchase Details
Closed on
May 5, 2011
Sold by
Ward Tonya C
Bought by
Wightman Paul
Home Financials for this Owner
Home Financials are based on the most recent Mortgage that was taken out on this home.
Original Mortgage
$173,500
Interest Rate
4.63%
Mortgage Type
Future Advance Clause Open End Mortgage
Purchase Details
Closed on
Apr 24, 2008
Sold by
Centex Homes
Bought by
Ward Tonya C
Home Financials for this Owner
Home Financials are based on the most recent Mortgage that was taken out on this home.
Original Mortgage
$50,001
Interest Rate
5.84%
Mortgage Type
Purchase Money Mortgage
Create a Home Valuation Report for This Property
The Home Valuation Report is an in-depth analysis detailing your home's value as well as a comparison with similar homes in the area
Home Values in the Area
Average Home Value in this Area
Purchase History
| Date | Buyer | Sale Price | Title Company |
|---|---|---|---|
| Paul And Mary Wightman Living Trust | -- | None Listed On Document | |
| Wightman Paul | $198,500 | -- | |
| Ward Tonya C | $214,500 | -- |
Source: Public Records
Mortgage History
| Date | Status | Borrower | Loan Amount |
|---|---|---|---|
| Previous Owner | Wightman Paul | $173,500 | |
| Previous Owner | Ward Tonya C | $50,001 |
Source: Public Records
Tax History Compared to Growth
Tax History
| Year | Tax Paid | Tax Assessment Tax Assessment Total Assessment is a certain percentage of the fair market value that is determined by local assessors to be the total taxable value of land and additions on the property. | Land | Improvement |
|---|---|---|---|---|
| 2025 | $1,342 | $246,230 | $45,914 | $200,316 |
| 2024 | $1,318 | $9,850 | $1,837 | $8,013 |
| 2023 | $1,318 | $9,850 | $1,837 | $8,013 |
| 2022 | $1,296 | $8,564 | $1,624 | $6,940 |
| 2021 | $1,400 | $8,560 | $1,624 | $6,940 |
| 2020 | $1,336 | $8,564 | $1,624 | $6,940 |
| 2019 | $1,281 | $8,564 | $1,624 | $6,940 |
| 2018 | $1,163 | $7,448 | $1,684 | $5,764 |
| 2017 | $1,154 | $7,448 | $1,684 | $5,764 |
| 2016 | $1,162 | $7,440 | $1,680 | $5,760 |
| 2015 | $3,495 | $7,440 | $1,680 | $5,760 |
| 2014 | $1,033 | $7,440 | $1,680 | $5,760 |
| 2013 | -- | $7,440 | $1,680 | $5,760 |
Source: Public Records
Map
Nearby Homes
- 261 Clayburne Dr
- 400 Watershed Dr
- 149 Salem Creek Dr
- 515 Flycatcher Dr
- 144 Old Jackson Rd
- 601 Watershed Dr
- 106 Cordoba Ct
- 159 Hawthorne Landing Dr
- 607 Watershed Dr
- 101 Patterson Ave
- 115 Hawthorne Landing Dr
- 542 Brick Barn Ln
- 104 Hawthorne Landing Dr
- 100 Hawthorne Landing Dr
- 146 Chaste Tree Cir
- 302 Chapman Cir
- 102 Chaste Tree Cir
- 406 Brookfield Ln
- 303 Bibiana Ln
- 107 Brick Park Ln
- 280 Clayburne Dr
- 278 Clayburne Dr
- 283 Clayburne Dr
- 276 Clayburne Dr
- 279 Clayburne Dr
- 285 Clayburne Dr
- 277 Clayburne Dr
- 274 Clayburne Dr
- 287 Clayburne Dr
- 275 Clayburne Dr
- 272 Clayburne Dr
- 289 Clayburne Dr
- 273 Clayburne Dr
- 421 Watershed Dr
- 270 Clayburne Dr
- 417 Watershed Dr
- 419 Watershed Dr
- 415 Watershed Dr
- 271 Clayburne Dr
- 268 Clayburne Dr