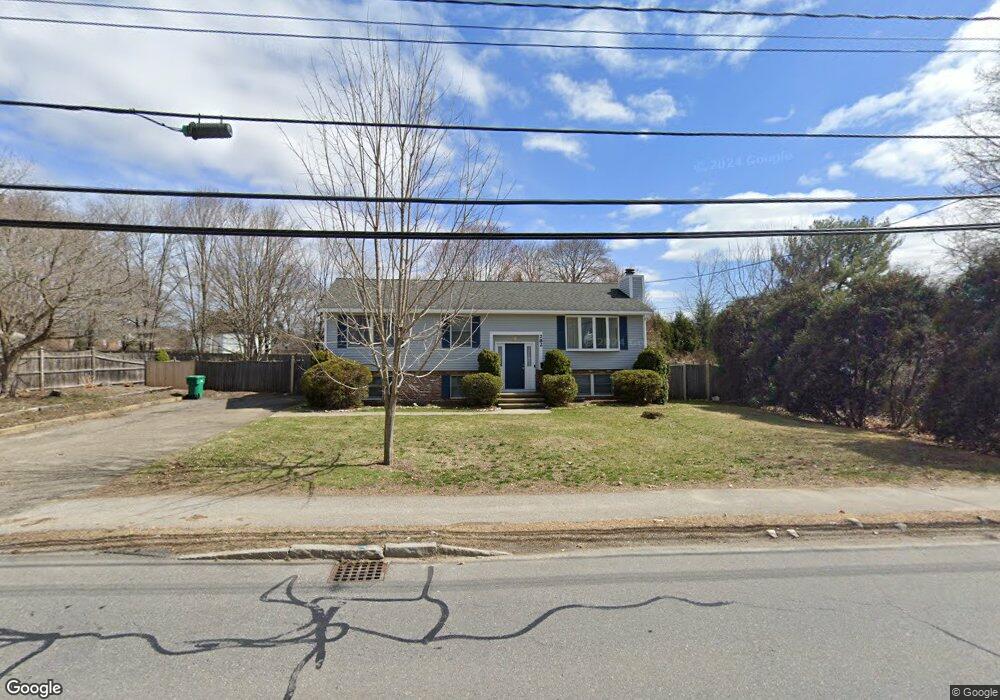
282 Commonwealth Ave Concord, MA 01742
Estimated Value: $850,000 - $1,055,000
3
Beds
3
Baths
1,235
Sq Ft
$777/Sq Ft
Est. Value
About This Home
This home is located at 282 Commonwealth Ave, Concord, MA 01742 and is currently estimated at $960,130, approximately $777 per square foot. 282 Commonwealth Ave is a home located in Middlesex County with nearby schools including Thoreau Elementary School, Concord Middle School, and Concord Carlisle High School.
Ownership History
Date
Name
Owned For
Owner Type
Purchase Details
Closed on
Sep 2, 2016
Sold by
Schultz Mary M
Bought by
Sieling Mary M
Current Estimated Value
Purchase Details
Closed on
Aug 28, 2013
Sold by
Schultz Hayden B
Bought by
Schultz Mary M
Purchase Details
Closed on
Sep 27, 1994
Sold by
Fhlmc
Bought by
Schultz Hayden B and Schultz Mary M
Purchase Details
Closed on
May 20, 1994
Sold by
Derby Richard J and Derby Patricia L
Bought by
Fhlmc
Create a Home Valuation Report for This Property
The Home Valuation Report is an in-depth analysis detailing your home's value as well as a comparison with similar homes in the area
Home Values in the Area
Average Home Value in this Area
Purchase History
| Date | Buyer | Sale Price | Title Company |
|---|---|---|---|
| Sieling Mary M | -- | -- | |
| Schultz Mary M | -- | -- | |
| Schultz Hayden B | $175,500 | -- | |
| Fhlmc | $199,000 | -- |
Source: Public Records
Mortgage History
| Date | Status | Borrower | Loan Amount |
|---|---|---|---|
| Previous Owner | Fhlmc | $183,500 |
Source: Public Records
Tax History
| Year | Tax Paid | Tax Assessment Tax Assessment Total Assessment is a certain percentage of the fair market value that is determined by local assessors to be the total taxable value of land and additions on the property. | Land | Improvement |
|---|---|---|---|---|
| 2025 | $108 | $811,500 | $420,700 | $390,800 |
| 2024 | $10,235 | $779,500 | $420,700 | $358,800 |
| 2023 | $9,720 | $750,000 | $382,400 | $367,600 |
| 2022 | $8,974 | $608,000 | $305,900 | $302,100 |
| 2021 | $8,785 | $596,800 | $305,900 | $290,900 |
| 2020 | $8,218 | $577,500 | $305,900 | $271,600 |
| 2019 | $8,339 | $587,700 | $316,100 | $271,600 |
| 2018 | $7,981 | $558,500 | $290,100 | $268,400 |
| 2017 | $7,428 | $527,900 | $269,400 | $258,500 |
| 2016 | $7,360 | $528,700 | $269,400 | $259,300 |
| 2015 | $6,893 | $482,400 | $249,500 | $232,900 |
Source: Public Records
Map
Nearby Homes
- 42 Sunnyside Ln
- 54 Maple St
- 95 Conant St Unit 320
- 79-81 Assabet Ave
- 22 Center Village Dr
- 111 Central St
- 70 McCallar Ln
- 16 Concord Greene Unit 5
- 245 Oak Hill Cir
- 53 Prairie St
- 47 Bridgecourt Ln
- 66 Old Stow Rd
- 55 Staffordshire Ln Unit B
- 45 Millrun Ln Unit 45
- 20 Westvale Meadows Unit C
- 65 Summit St
- 60 Lawsbrook Rd
- 27 Water St
- 37 Water St
- 1 Baker Ave
- 294 Commonwealth Ave
- 266 Commonwealth Ave
- 272 Commonwealth Ave
- 287 Commonwealth Ave
- 271 Commonwealth Ave Unit 271
- 302 Commonwealth Ave
- 293 Commonwealth Ave
- 269 Commonwealth Ave
- 260 Commonwealth Ave
- 308 Commonwealth Ave
- 303 Commonwealth Ave
- 263 Commonwealth Ave Unit 265
- 254 Commonwealth Ave Unit 254
- 257 Commonwealth Ave
- 255 Commonwealth Ave
- 257 Commonwealth Ave Unit 1
- 257 Commonwealth Ave Unit 257
- 316 Commonwealth Ave
- 311 Commonwealth Ave
- 252 Commonwealth Ave
Your Personal Tour Guide
Ask me questions while you tour the home.