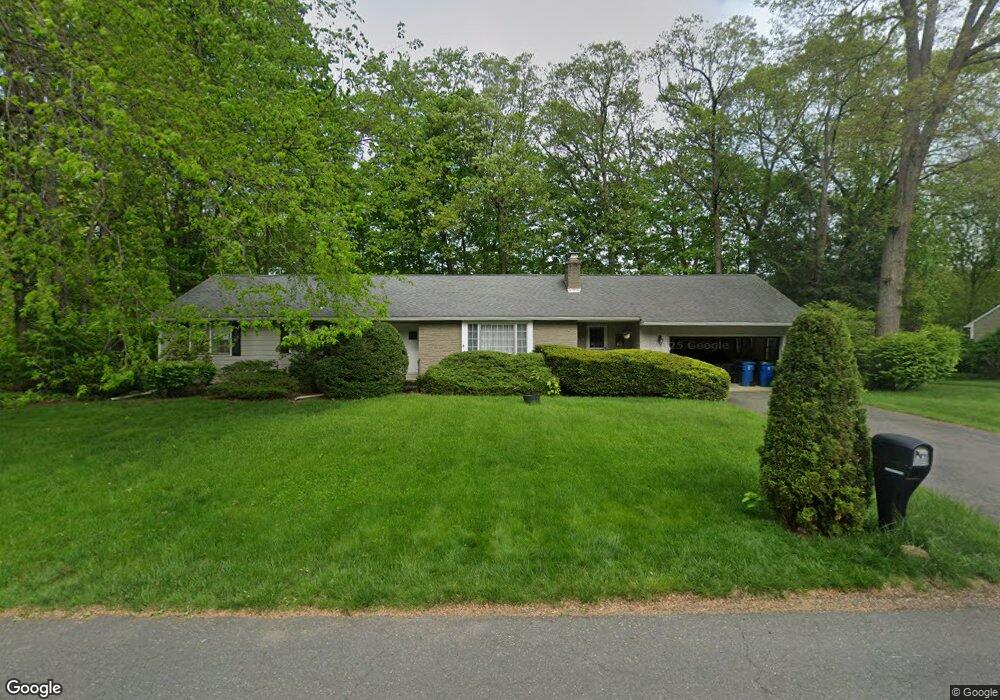
282 Forest Glen West Springfield, MA 01089
Estimated Value: $471,374 - $489,000
3
Beds
2
Baths
2,226
Sq Ft
$216/Sq Ft
Est. Value
About This Home
This home is located at 282 Forest Glen, West Springfield, MA 01089 and is currently estimated at $481,594, approximately $216 per square foot. 282 Forest Glen is a home located in Hampden County with nearby schools including St Thomas The Apostle School.
Ownership History
Date
Name
Owned For
Owner Type
Purchase Details
Closed on
Jul 13, 2023
Sold by
Wesniak Barbara M and Wesniak Joseph J
Bought by
Wesniak Barbara M and Wesniak Joseph J
Current Estimated Value
Home Financials for this Owner
Home Financials are based on the most recent Mortgage that was taken out on this home.
Original Mortgage
$200,000
Outstanding Balance
$194,832
Interest Rate
6.79%
Mortgage Type
New Conventional
Estimated Equity
$286,762
Purchase Details
Closed on
Feb 8, 2019
Sold by
Wesniak Barbara M
Bought by
Wesniak Barbara M and Wesniak Joseph J
Purchase Details
Closed on
Dec 18, 2018
Sold by
Wesniak Joseph J
Bought by
Wesniak Barbara M
Create a Home Valuation Report for This Property
The Home Valuation Report is an in-depth analysis detailing your home's value as well as a comparison with similar homes in the area
Home Values in the Area
Average Home Value in this Area
Purchase History
| Date | Buyer | Sale Price | Title Company |
|---|---|---|---|
| Wesniak Barbara M | -- | None Available | |
| Wesniak Barbara M | -- | None Available | |
| Wesniak Barbara M | -- | -- | |
| Wesniak Barbara M | -- | -- | |
| Wesniak Barbara M | -- | -- | |
| Wesniak Barbara M | -- | -- |
Source: Public Records
Mortgage History
| Date | Status | Borrower | Loan Amount |
|---|---|---|---|
| Open | Wesniak Barbara M | $200,000 | |
| Closed | Wesniak Barbara M | $200,000 |
Source: Public Records
Tax History Compared to Growth
Tax History
| Year | Tax Paid | Tax Assessment Tax Assessment Total Assessment is a certain percentage of the fair market value that is determined by local assessors to be the total taxable value of land and additions on the property. | Land | Improvement |
|---|---|---|---|---|
| 2025 | $5,884 | $395,700 | $138,700 | $257,000 |
| 2024 | $5,850 | $395,000 | $138,700 | $256,300 |
| 2023 | $5,681 | $365,600 | $145,700 | $219,900 |
| 2022 | $5,119 | $324,800 | $132,200 | $192,600 |
| 2021 | $5,156 | $305,100 | $125,600 | $179,500 |
| 2020 | $5,173 | $304,500 | $125,600 | $178,900 |
| 2019 | $5,164 | $304,500 | $125,600 | $178,900 |
| 2018 | $5,192 | $304,500 | $125,600 | $178,900 |
| 2017 | $5,192 | $304,500 | $125,600 | $178,900 |
| 2016 | $5,128 | $301,800 | $120,500 | $181,300 |
| 2015 | $5,029 | $296,000 | $118,200 | $177,800 |
| 2014 | $1,222 | $296,000 | $118,200 | $177,800 |
Source: Public Records
Map
Nearby Homes
- 283 Forest Glen
- 43 Wishing Well Way
- 31 Stone Path Ln
- 34 High Meadow Dr
- 514 Dewey St
- 260 Wolcott Ave
- 42 Gregory Ln
- 86 Birnie Ave
- 180 Wolcott Ave
- 32 Lotus Ave
- 139 Upper Beverly Hills
- 16 North St
- 65 Verdugo St
- 61 Clarence St
- 17 Laurence Dr
- 142 Morton St
- 19 Cora St
- 81 Laurence Dr
- 42 Janet St
- 36 Shady Brook
- 60 Forest Glen
- 268 Forest Glen
- 291 Forest Glen
- 86 Forest Glen
- 269 Forest Glen
- 35 Forest Glen
- 258 Forest Glen
- 301 Forest Glen
- 65 Forest Glen
- 261 Forest Glen
- 96 Forest Glen
- 73 Forest Glen
- 246 Forest Glen
- 702 Rogers Ave
- 714 Rogers Ave
- 81 Forest Glen
- 786 Dewey St
- 245 Forest Glen
- 722 Rogers Ave
- 684 Rogers Ave