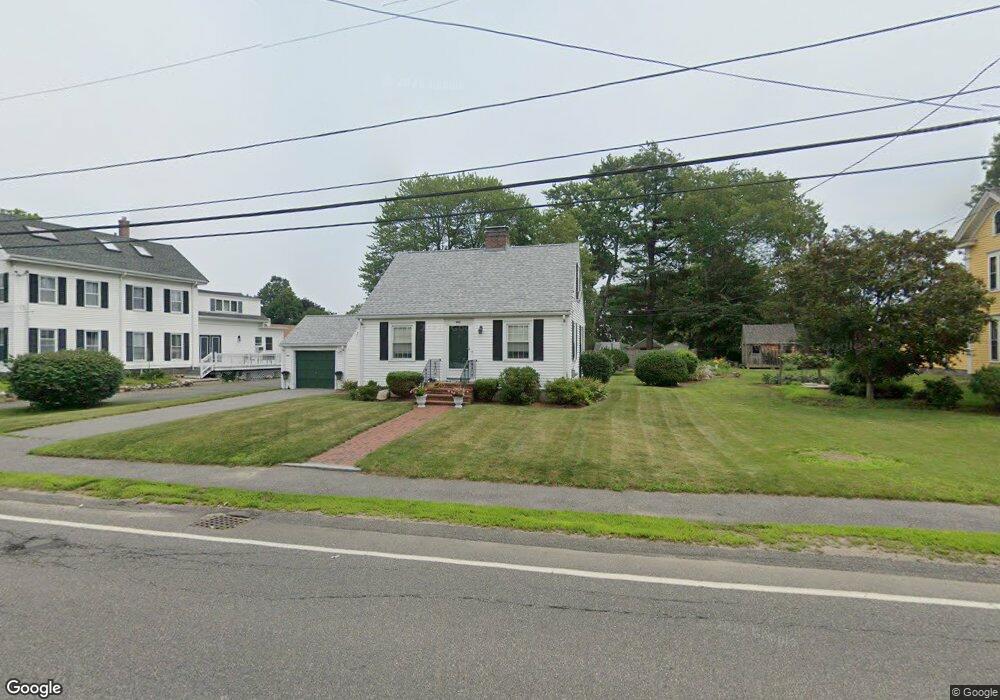
282 Front St Weymouth, MA 02188
Weymouth Landing NeighborhoodEstimated Value: $549,075 - $648,000
2
Beds
1
Bath
1,260
Sq Ft
$469/Sq Ft
Est. Value
About This Home
This home is located at 282 Front St, Weymouth, MA 02188 and is currently estimated at $591,519, approximately $469 per square foot. 282 Front St is a home located in Norfolk County with nearby schools including Frederick C Murphy, Abigail Adams Middle School, and Weymouth Middle School Chapman.
Ownership History
Date
Name
Owned For
Owner Type
Purchase Details
Closed on
Aug 26, 2025
Sold by
Connolly Mary C
Bought by
Mary C Connolly 2025 Ret and Connolly
Current Estimated Value
Purchase Details
Closed on
Jan 11, 2007
Sold by
Wohlander Lt and Wohlander
Bought by
Connolly Mary C
Home Financials for this Owner
Home Financials are based on the most recent Mortgage that was taken out on this home.
Original Mortgage
$275,000
Interest Rate
6.18%
Mortgage Type
Purchase Money Mortgage
Create a Home Valuation Report for This Property
The Home Valuation Report is an in-depth analysis detailing your home's value as well as a comparison with similar homes in the area
Home Values in the Area
Average Home Value in this Area
Purchase History
| Date | Buyer | Sale Price | Title Company |
|---|---|---|---|
| Mary C Connolly 2025 Ret | -- | -- | |
| Connolly Mary C | $315,000 | -- | |
| Connolly Mary C | $315,000 | -- | |
| Connolly Mary C | $315,000 | -- |
Source: Public Records
Mortgage History
| Date | Status | Borrower | Loan Amount |
|---|---|---|---|
| Previous Owner | Connolly Mary C | $267,100 | |
| Previous Owner | Connolly Mary C | $275,000 |
Source: Public Records
Tax History
| Year | Tax Paid | Tax Assessment Tax Assessment Total Assessment is a certain percentage of the fair market value that is determined by local assessors to be the total taxable value of land and additions on the property. | Land | Improvement |
|---|---|---|---|---|
| 2025 | $4,840 | $479,200 | $201,700 | $277,500 |
| 2024 | $4,691 | $456,800 | $192,100 | $264,700 |
| 2023 | $4,423 | $423,300 | $177,900 | $245,400 |
| 2022 | $4,322 | $377,100 | $164,700 | $212,400 |
| 2021 | $4,014 | $341,900 | $164,700 | $177,200 |
| 2020 | $3,804 | $319,100 | $164,700 | $154,400 |
| 2019 | $3,714 | $306,400 | $158,400 | $148,000 |
| 2018 | $3,605 | $288,400 | $150,800 | $137,600 |
| 2017 | $3,497 | $273,000 | $143,700 | $129,300 |
| 2016 | $3,308 | $258,400 | $138,200 | $120,200 |
| 2015 | $3,200 | $248,100 | $138,200 | $109,900 |
| 2014 | $3,020 | $227,100 | $128,600 | $98,500 |
Source: Public Records
Map
Nearby Homes
- 33 Congress St
- 107 Summer St
- 15 Summer St
- 19 Vine St Unit 3
- 19 Vine St Unit 2
- 11 Richmond St
- 25 Richmond St
- 122 Washington St Unit Twenty-two
- 82 Lester Ln
- 46 Roosevelt Rd
- 37 Lantern Ln
- 116 Greenvale Ave
- 41 Lantern Ln
- 211 Roosevelt Rd
- 747 Middle St
- 49 Cornish St
- 29-31 Broad Street Place
- 270 Middle St
- 16 Beechwood Rd
- 54 Edgemont Rd
Your Personal Tour Guide
Ask me questions while you tour the home.