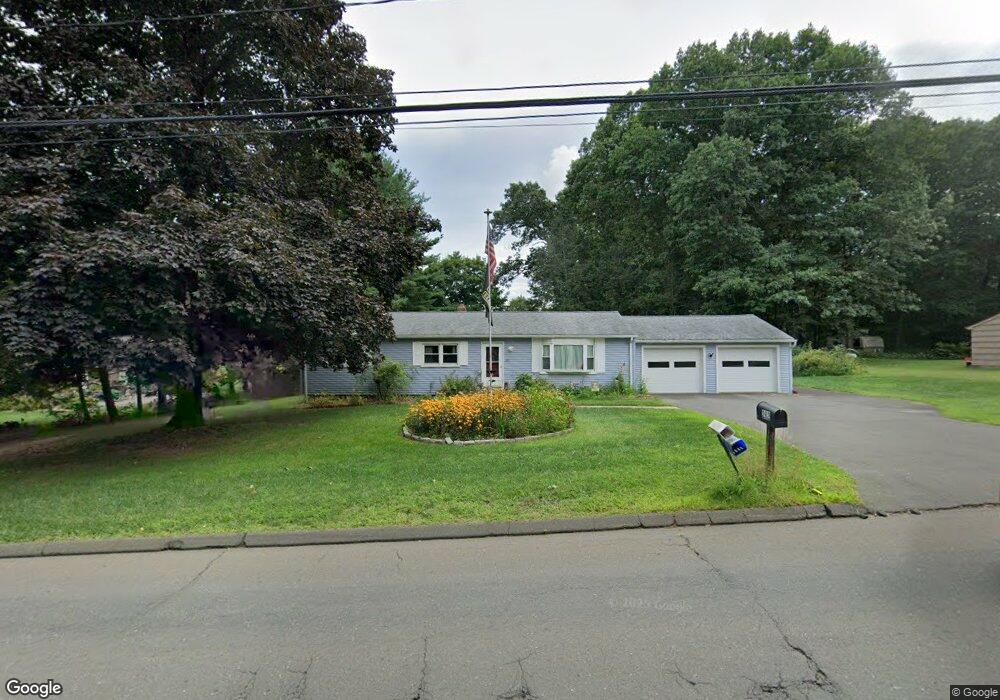
282 Loper St Southington, CT 06489
East Southington NeighborhoodEstimated Value: $379,000 - $423,000
3
Beds
2
Baths
1,200
Sq Ft
$339/Sq Ft
Est. Value
About This Home
This home is located at 282 Loper St, Southington, CT 06489 and is currently estimated at $406,247, approximately $338 per square foot. 282 Loper St is a home located in Hartford County with nearby schools including Reuben E. Thalberg Elementary School, Joseph A. Depaolo Middle School, and Southington High School.
Ownership History
Date
Name
Owned For
Owner Type
Purchase Details
Closed on
Apr 9, 1998
Sold by
Kulak Joan M and Kulak Henry A
Bought by
Pintarich Stephen P and Pintarich Barbara R
Current Estimated Value
Home Financials for this Owner
Home Financials are based on the most recent Mortgage that was taken out on this home.
Original Mortgage
$142,250
Interest Rate
6.98%
Mortgage Type
Unknown
Create a Home Valuation Report for This Property
The Home Valuation Report is an in-depth analysis detailing your home's value as well as a comparison with similar homes in the area
Home Values in the Area
Average Home Value in this Area
Purchase History
| Date | Buyer | Sale Price | Title Company |
|---|---|---|---|
| Pintarich Stephen P | $142,250 | -- |
Source: Public Records
Mortgage History
| Date | Status | Borrower | Loan Amount |
|---|---|---|---|
| Closed | Pintarich Stephen P | $115,000 | |
| Closed | Pintarich Stephen P | $131,500 | |
| Closed | Pintarich Stephen P | $12,000 | |
| Closed | Pintarich Stephen P | $142,250 |
Source: Public Records
Tax History Compared to Growth
Tax History
| Year | Tax Paid | Tax Assessment Tax Assessment Total Assessment is a certain percentage of the fair market value that is determined by local assessors to be the total taxable value of land and additions on the property. | Land | Improvement |
|---|---|---|---|---|
| 2025 | $5,748 | $173,070 | $63,550 | $109,520 |
| 2024 | $5,441 | $173,070 | $63,550 | $109,520 |
| 2023 | $5,254 | $173,070 | $63,550 | $109,520 |
| 2022 | $5,042 | $173,070 | $63,550 | $109,520 |
| 2021 | $5,024 | $173,070 | $63,550 | $109,520 |
| 2020 | $5,024 | $164,010 | $64,860 | $99,150 |
| 2019 | $5,025 | $164,010 | $64,860 | $99,150 |
| 2018 | $4,999 | $164,010 | $64,860 | $99,150 |
| 2017 | $4,999 | $164,010 | $64,860 | $99,150 |
| 2016 | $4,861 | $164,010 | $64,860 | $99,150 |
| 2015 | $4,846 | $166,310 | $61,760 | $104,550 |
| 2014 | $4,717 | $166,310 | $61,760 | $104,550 |
Source: Public Records
Map
Nearby Homes
- 185 Woodberry Hill Dr
- 285 Queen St Unit 4B
- 248 Annelise Ave
- 90 Apple Gate Unit 77
- 90 Apple Gate Unit 188
- 90 Apple Gate Unit 186
- 273 Queen St Unit 9A
- 81 Laning St
- 19 Malcein Dr
- 337 Flanders St
- 23 Woodfield Rd
- 922 Flanders Rd
- 500 Darling St Unit 16 D
- 500 Darling St Unit 23 C
- 110 Rethal St
- 147 Rethal St
- 228 Pattonwood Dr
- 138 Butler Ave
- 244 Curtiss St
- 199 Darling St
- 10 Annelise Ave
- 270 Loper St
- 26 Annelise Ave
- 9 Woodberry Hill Dr
- 38 Annelise Ave
- 258 Loper St
- 13 Annelise Ave
- 23 Woodberry Hill Dr
- 50 Annelise Ave
- 265 Loper St
- 246 Loper St
- 10 Woodberry Hill Dr
- 37 Annelise Ave
- 25 Annelise Ave
- 324 Loper St
- 20 Woodberry Hill Dr
- 49 Annelise Ave
- 249 Loper St
- 35 Woodberry Hill Dr
- 60 Annelise Ave