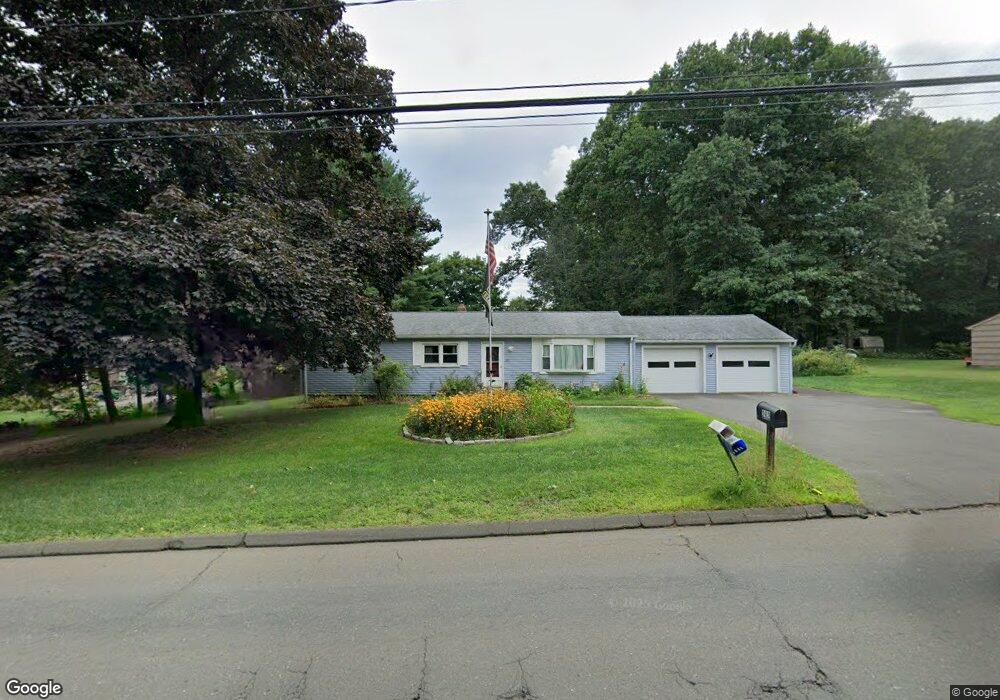
282 Loper St Southington, CT 06489
East Southington NeighborhoodEstimated Value: $418,075 - $451,000
About This Home
This home is located at 282 Loper St, Southington, CT 06489 and is currently estimated at $428,769, approximately $357 per square foot. 282 Loper St is a home located in Hartford County with nearby schools including Reuben E. Thalberg Elementary School, Joseph A. Depaolo Middle School, and Southington High School.
Ownership History
We collect this data history from publicly available records. To have your information removed, we recommend requesting removal directly through your county’s website.
Purchase Details
Home Financials for this Owner
Home Financials are based on the most recent Mortgage that was taken out on this home.Home Values in the Area
Average Home Value in this Area
Purchase History
We collect this data history from publicly available records. To have your information removed, we recommend requesting removal directly through your county’s website.
| Date | Buyer | Sale Price | Title Company |
|---|---|---|---|
| $142,250 | -- |
Mortgage History
We collect this data history from publicly available records. To have your information removed, we recommend requesting removal directly through your county’s website.
| Date | Status | Borrower | Loan Amount |
|---|---|---|---|
| Closed | $115,000 | ||
| Closed | $131,500 | ||
| Closed | $12,000 | ||
| Closed | $142,250 |
Tax History
We collect this data history from publicly available records. To have your information removed, we recommend requesting removal directly through your county’s website.
| Year | Tax Paid | Tax Assessment Tax Assessment Total Assessment is a certain percentage of the fair market value that is determined by local assessors to be the total taxable value of land and additions on the property. | Land | Improvement |
|---|---|---|---|---|
| 2025 | $5,748 | $173,070 | $63,550 | $109,520 |
| 2024 | $5,441 | $173,070 | $63,550 | $109,520 |
| 2023 | $5,254 | $173,070 | $63,550 | $109,520 |
| 2022 | $5,042 | $173,070 | $63,550 | $109,520 |
| 2021 | $5,024 | $173,070 | $63,550 | $109,520 |
| 2020 | $5,024 | $164,010 | $64,860 | $99,150 |
| 2019 | $5,025 | $164,010 | $64,860 | $99,150 |
| 2018 | $4,999 | $164,010 | $64,860 | $99,150 |
| 2017 | $4,999 | $164,010 | $64,860 | $99,150 |
| 2016 | $4,861 | $164,010 | $64,860 | $99,150 |
| 2015 | $4,846 | $166,310 | $61,760 | $104,550 |
| 2014 | $4,717 | $166,310 | $61,760 | $104,550 |
Map
- 194 Loper St
- 45 Macintosh Way
- 90 Apple Gate Unit 190
- 90 Apple Gate Unit 95
- 273 Queen St Unit 14E
- 30 Malcein Dr
- 81 Laning St
- 90 Baldwin Cir
- 550 Darling St Unit 42B
- 82 Cianci Dr
- 500 Darling St Unit 11Q
- 207 Lazy Ln Unit 9
- 207 Lazy Ln Unit 7
- 207 Lazy Ln Unit 10
- 207 Lazy Ln Unit 2
- 207 Lazy Ln Unit 1
- 207 Lazy Ln Unit 6
- 207 Lazy Ln Unit 12
- 207 Lazy Ln Unit 11
- 207 Lazy Ln Unit 8
- 10 Annelise Ave
- 270 Loper St
- 26 Annelise Ave
- 9 Woodberry Hill Dr
- 38 Annelise Ave
- 258 Loper St
- 13 Annelise Ave
- 23 Woodberry Hill Dr
- 50 Annelise Ave
- 265 Loper St
- 246 Loper St
- 10 Woodberry Hill Dr
- 37 Annelise Ave
- 25 Annelise Ave
- 324 Loper St
- 20 Woodberry Hill Dr
- 49 Annelise Ave
- 249 Loper St
- 35 Woodberry Hill Dr
- 60 Annelise Ave
Ask me questions while you tour the home.