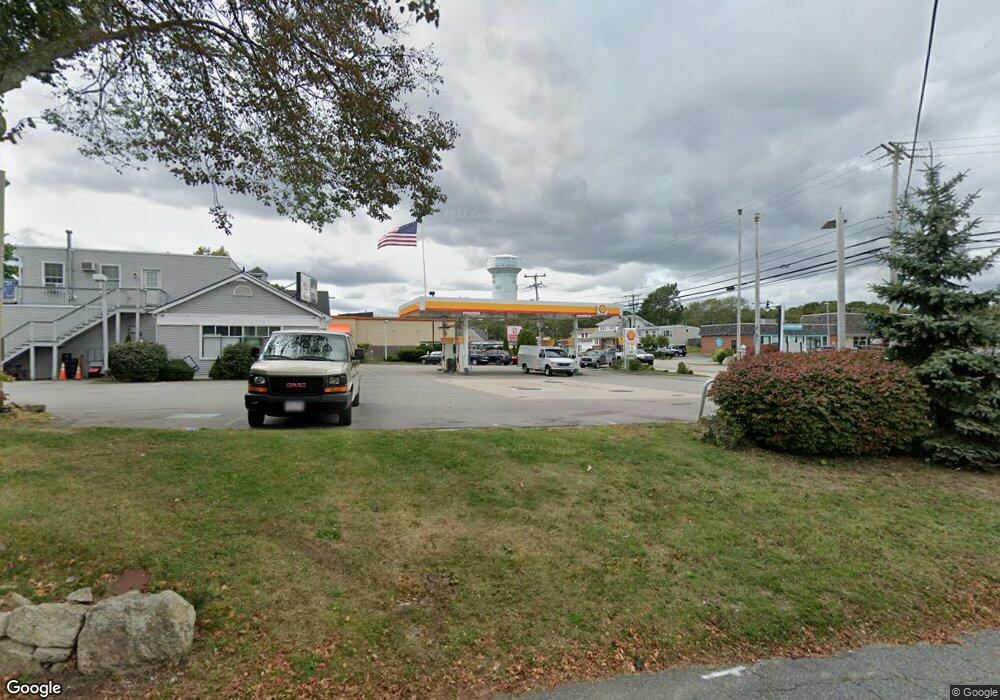
282 Main St Bourne, MA 02532
Buzzards Bay Neighborhood
Studio
--
Bath
4,758
Sq Ft
31,712
Sq Ft Lot
About This Home
This home is located at 282 Main St, Bourne, MA 02532. 282 Main St is a home located in Barnstable County with nearby schools including Bourne High School and St Margaret Regional School.
Ownership History
Date
Name
Owned For
Owner Type
Purchase Details
Closed on
Apr 27, 2023
Sold by
Bourne Gary J and Bourne Irene E
Bought by
Bourne Main Street Llc
Purchase Details
Closed on
Nov 5, 1998
Sold by
Sun Co Inc
Bought by
Bourne Sunoco Rt and Bourne
Home Financials for this Owner
Home Financials are based on the most recent Mortgage that was taken out on this home.
Original Mortgage
$405,000
Interest Rate
6.64%
Mortgage Type
Commercial
Create a Home Valuation Report for This Property
The Home Valuation Report is an in-depth analysis detailing your home's value as well as a comparison with similar homes in the area
Home Values in the Area
Average Home Value in this Area
Purchase History
| Date | Buyer | Sale Price | Title Company |
|---|---|---|---|
| Bourne Main Street Llc | -- | None Available | |
| Bourne Main Street Llc | -- | None Available | |
| Bourne Gary J | -- | None Available | |
| Bourne Gary J | -- | None Available | |
| Bourne Sunoco Rt | $350,000 | -- | |
| Bourne Sunoco Rt | $350,000 | -- |
Source: Public Records
Mortgage History
| Date | Status | Borrower | Loan Amount |
|---|---|---|---|
| Previous Owner | Bourne Sunoco Rt | $630,000 | |
| Previous Owner | Bourne Sunoco Rt | $400,000 | |
| Previous Owner | Bourne Sunoco Rt | $405,000 |
Source: Public Records
Tax History
| Year | Tax Paid | Tax Assessment Tax Assessment Total Assessment is a certain percentage of the fair market value that is determined by local assessors to be the total taxable value of land and additions on the property. | Land | Improvement |
|---|---|---|---|---|
| 2025 | $10,406 | $1,332,400 | $346,500 | $985,900 |
| 2024 | $10,229 | $1,275,400 | $330,000 | $945,400 |
| 2023 | $10,831 | $1,229,400 | $317,300 | $912,100 |
| 2022 | $11,301 | $1,120,000 | $298,300 | $821,700 |
| 2021 | $11,813 | $1,096,800 | $289,600 | $807,200 |
| 2020 | $14,352 | $1,336,300 | $534,500 | $801,800 |
| 2019 | $13,913 | $1,323,800 | $524,000 | $799,800 |
| 2018 | $13,503 | $1,281,100 | $503,900 | $777,200 |
| 2017 | $13,075 | $1,269,400 | $498,800 | $770,600 |
| 2016 | $13,013 | $1,280,800 | $498,800 | $782,000 |
| 2015 | $12,898 | $1,280,800 | $498,800 | $782,000 |
Source: Public Records
Map
Nearby Homes
- 304 Main St
- 38 Old Bridge Rd
- 58 Maple St
- 6 Honora Ct
- 3 Honora Ln Unit 3
- 23 Alderberry Rd
- 46 Holt Rd Unit B
- 46 Holt Rd
- 60 Sandwich Rd
- 44 Cotuit Rd
- 10 Sandy Ln
- 40-A Lafayette Ave
- 5 Zoli Ln
- 4 Van Bummel Rd
- 24 Ships View Terrace
- 60 Bourne Neck Dr
- 13 Laurel Hill Ct
- 810 Head of The Bay Rd
- 5 Sea Knoll Ct
- 9 Hideaway Rd Unit F
- 282 Main St Unit 2
- 278 Main St
- 7 Old Bridge Rd
- 7 Old Bridge Rd
- 6 Old Bridge Rd
- 279 Main St Unit 279
- 279 Main St Unit 1
- 279 Main St Unit *
- 279 Main St
- 279 Main St
- 9 Old Bridge Rd
- 277 Main St
- 277 Main St
- 11 Old Bridge Rd
- 11 Old Bridge Rd
- 11 Old Bridge Rd
- 275 Main St
- 283 Main St
- 13 Old Bridge Rd
- 13 Old Bridge Rd
Your Personal Tour Guide
Ask me questions while you tour the home.