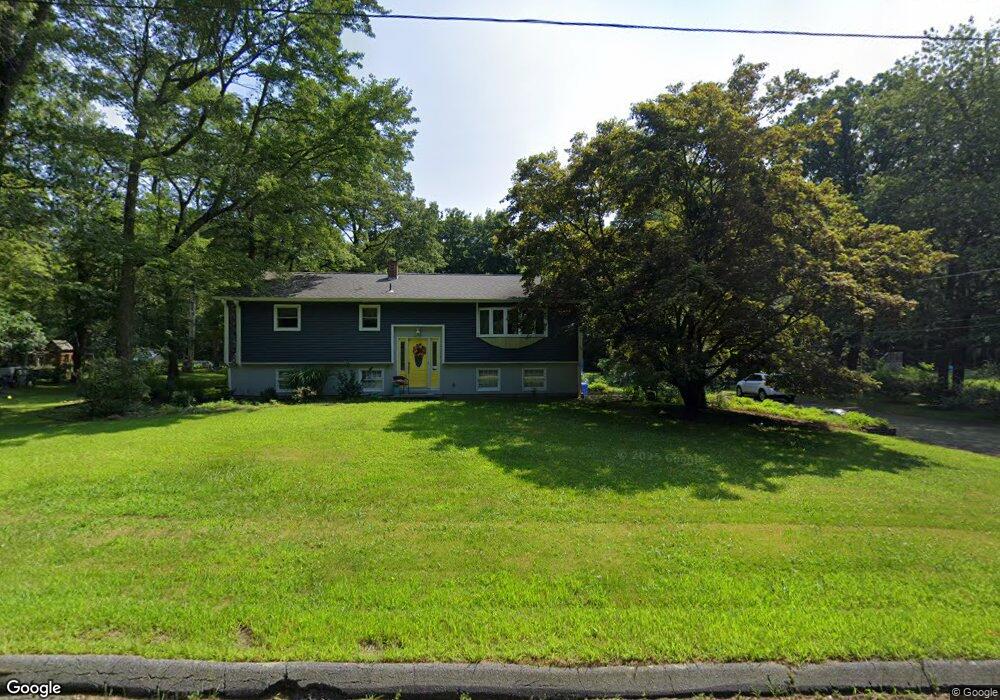
282 Margaret Henry Rd Danielson, CT 06239
Estimated Value: $305,000 - $360,000
3
Beds
2
Baths
1,050
Sq Ft
$323/Sq Ft
Est. Value
About This Home
This home is located at 282 Margaret Henry Rd, Danielson, CT 06239 and is currently estimated at $338,641, approximately $322 per square foot. 282 Margaret Henry Rd is a home located in Windham County with nearby schools including Killingly Central School, Killingly Memorial School, and Killingly Intermediate School.
Ownership History
Date
Name
Owned For
Owner Type
Purchase Details
Closed on
Apr 21, 2014
Sold by
Department Of Housing & Urban Dev
Bought by
Shaw April L and Gilbert David P
Current Estimated Value
Purchase Details
Closed on
Nov 20, 2013
Sold by
Chfa
Bought by
Department Of Housing & Urban Dev
Purchase Details
Closed on
Feb 13, 2013
Sold by
Courtemanche Steven and Gainer Sharay
Bought by
Chfa
Purchase Details
Closed on
Jun 30, 2009
Sold by
Deutsche Bank Natl T C
Bought by
Courtemanche Steven and Gainer Shanay
Purchase Details
Closed on
May 17, 2005
Sold by
Manning Sheila
Bought by
Sutera Christopher M
Purchase Details
Closed on
Oct 30, 2001
Sold by
Mcdermott Michael J and Mcdermott Kristen M
Bought by
Manning Sheila
Purchase Details
Closed on
Apr 26, 1989
Sold by
Battista Ronald
Bought by
Mcdermott Michael
Create a Home Valuation Report for This Property
The Home Valuation Report is an in-depth analysis detailing your home's value as well as a comparison with similar homes in the area
Home Values in the Area
Average Home Value in this Area
Purchase History
| Date | Buyer | Sale Price | Title Company |
|---|---|---|---|
| Shaw April L | $134,950 | -- | |
| Shaw April L | $134,950 | -- | |
| Department Of Housing & Urban Dev | -- | -- | |
| Department Of Housing & Urban Dev | -- | -- | |
| Chfa | -- | -- | |
| Chfa | -- | -- | |
| Courtemanche Steven | $144,900 | -- | |
| Courtemanche Steven | $144,900 | -- | |
| Sutera Christopher M | $200,000 | -- | |
| Sutera Christopher M | $200,000 | -- | |
| Manning Sheila | $138,900 | -- | |
| Manning Sheila | $138,900 | -- | |
| Mcdermott Michael | $122,000 | -- |
Source: Public Records
Mortgage History
| Date | Status | Borrower | Loan Amount |
|---|---|---|---|
| Open | Mcdermott Michael | $153,075 |
Source: Public Records
Tax History Compared to Growth
Tax History
| Year | Tax Paid | Tax Assessment Tax Assessment Total Assessment is a certain percentage of the fair market value that is determined by local assessors to be the total taxable value of land and additions on the property. | Land | Improvement |
|---|---|---|---|---|
| 2025 | $3,962 | $170,470 | $40,990 | $129,480 |
| 2024 | $3,769 | $170,470 | $40,990 | $129,480 |
| 2023 | $3,807 | $130,970 | $33,740 | $97,230 |
| 2022 | $3,579 | $130,970 | $33,740 | $97,230 |
| 2021 | $3,568 | $130,970 | $33,740 | $97,230 |
| 2020 | $3,502 | $130,970 | $33,740 | $97,230 |
| 2019 | $3,557 | $130,970 | $33,740 | $97,230 |
| 2017 | $3,105 | $108,150 | $26,740 | $81,410 |
| 2016 | $3,105 | $108,150 | $26,740 | $81,410 |
| 2015 | $3,105 | $108,150 | $26,740 | $81,410 |
| 2014 | $3,018 | $108,150 | $26,740 | $81,410 |
Source: Public Records
Map
Nearby Homes
- 129 Snake Meadow Rd
- 99 Snake Meadow Rd
- 564 Hubbard Rd
- 55,94,100 Hubbard Hi Klocek Rd
- 150 Ross Rd
- 160 Ross Rd
- Lot 2 Klosek Rd
- 79 Cucumber Hill Rd
- 188 Danielson Pike
- 330 Cook Hill Rd
- 395 Bailey Hill Rd
- 64 Westcott Rd
- 43 Fall Brook Rd
- 181 Snake Meadow Rd
- 8 Boswell Trail
- 513 Lhomme Street Extension
- 247 Green Hollow Rd
- 612 Cook Hill Rd
- 85 Mashentuck Rd
- 175 Mashentuck Rd
- 276 Margaret Henry Rd
- 270 Margaret Henry Rd
- 296 Margaret Henry Rd
- 292 Margaret Henry Rd
- 277 Margaret Henry Rd
- 262 Margaret Henry Rd
- 267 Margaret Henry Rd
- 258 Margaret Henry Rd
- 256 Margaret Henry Rd
- 305 Margaret Henry Rd
- 250 Margaret Henry Rd
- 259 Margaret Henry Rd
- 252 Margaret Henry Rd
- 320 Margaret Henry Rd
- 308 Margaret Henry Rd
- 249 Margaret Henry Rd
- 244 Margaret Henry Rd
- 112 Sawmill Hill Rd
- 112 Sawmill Hill Rd
- 314 Margaret Henry Rd