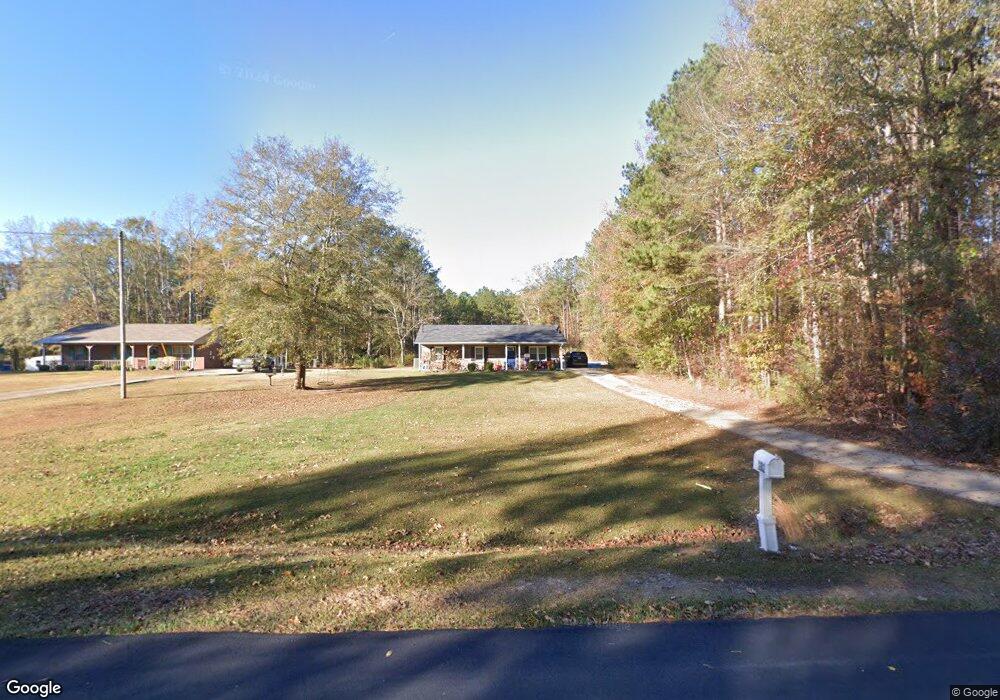
282 Reed Rd West Point, GA 31833
Estimated Value: $206,919 - $307,000
3
Beds
2
Baths
1,592
Sq Ft
$154/Sq Ft
Est. Value
About This Home
This home is located at 282 Reed Rd, West Point, GA 31833 and is currently estimated at $244,730, approximately $153 per square foot. 282 Reed Rd is a home located in Troup County with nearby schools including West Point Elementary School, Long Cane Elementary School, and Berta Weathersbee Elementary School.
Ownership History
Date
Name
Owned For
Owner Type
Purchase Details
Closed on
Sep 14, 2020
Sold by
Teall Evan
Bought by
Harry Steven and Harry Grace
Current Estimated Value
Home Financials for this Owner
Home Financials are based on the most recent Mortgage that was taken out on this home.
Original Mortgage
$154,646
Outstanding Balance
$137,238
Interest Rate
2.9%
Mortgage Type
FHA
Estimated Equity
$107,492
Purchase Details
Closed on
Sep 29, 2017
Bought by
Teall Evan
Purchase Details
Closed on
Jun 6, 2017
Sold by
Atkinson Arthur Lee
Bought by
Us Bank National Association T
Purchase Details
Closed on
Jun 1, 1987
Sold by
Dan-Ric Inc
Bought by
Atkinson Arthur Lee
Purchase Details
Closed on
Oct 6, 1986
Sold by
Miller Henry D
Bought by
Dan-Ric Inc
Purchase Details
Closed on
Jan 1, 1986
Bought by
Miller Henry D
Create a Home Valuation Report for This Property
The Home Valuation Report is an in-depth analysis detailing your home's value as well as a comparison with similar homes in the area
Home Values in the Area
Average Home Value in this Area
Purchase History
| Date | Buyer | Sale Price | Title Company |
|---|---|---|---|
| Harry Steven | $157,500 | -- | |
| Teall Evan | $41,000 | -- | |
| Us Bank National Association T | -- | -- | |
| Atkinson Arthur Lee | $49,900 | -- | |
| Dan-Ric Inc | $25,000 | -- | |
| Miller Henry D | -- | -- |
Source: Public Records
Mortgage History
| Date | Status | Borrower | Loan Amount |
|---|---|---|---|
| Open | Harry Steven | $154,646 |
Source: Public Records
Tax History Compared to Growth
Tax History
| Year | Tax Paid | Tax Assessment Tax Assessment Total Assessment is a certain percentage of the fair market value that is determined by local assessors to be the total taxable value of land and additions on the property. | Land | Improvement |
|---|---|---|---|---|
| 2024 | $1,747 | $64,072 | $5,000 | $59,072 |
| 2023 | $1,677 | $61,476 | $5,000 | $56,476 |
| 2022 | $1,571 | $56,276 | $5,000 | $51,276 |
| 2021 | $1,440 | $47,744 | $4,240 | $43,504 |
| 2020 | $1,440 | $47,744 | $4,240 | $43,504 |
| 2019 | $1,042 | $34,556 | $4,000 | $30,556 |
| 2018 | $486 | $16,104 | $4,000 | $12,104 |
| 2017 | $933 | $32,920 | $4,000 | $28,920 |
| 2016 | $932 | $32,885 | $4,000 | $28,885 |
| 2015 | $934 | $32,885 | $4,000 | $28,885 |
| 2014 | $889 | $31,365 | $4,000 | $27,365 |
| 2013 | -- | $32,716 | $4,000 | $28,716 |
Source: Public Records
Map
Nearby Homes
- 1599 Highway 29
- 0 Lambert Rd
- 0 Ga Highway 0116 Unit 10619139
- 1903 Ridgewood Dr
- 508 Pine St
- 0 Sandtown Rd Unit 10255987
- Sandtown Road Unit: 1 2+ - Acre
- 797 Gabbettville Rd
- 1095 County Road 212
- 1505 Wisteria Dr
- 0 Johns Rd Unit 10615130
- 1103 Clara Dr
- 1109 Clara Dr
- 1111 Clara Dr
- 1105 Clara Dr
- 1107 Clara Dr
- 111 Tudor Way
- 0 Sunset Dr Unit 10451831
- 4517 Georgia 18
- 4509 Georgia 18