Estimated Value: $304,000 - $326,768
4
Beds
3
Baths
2,240
Sq Ft
$142/Sq Ft
Est. Value
About This Home
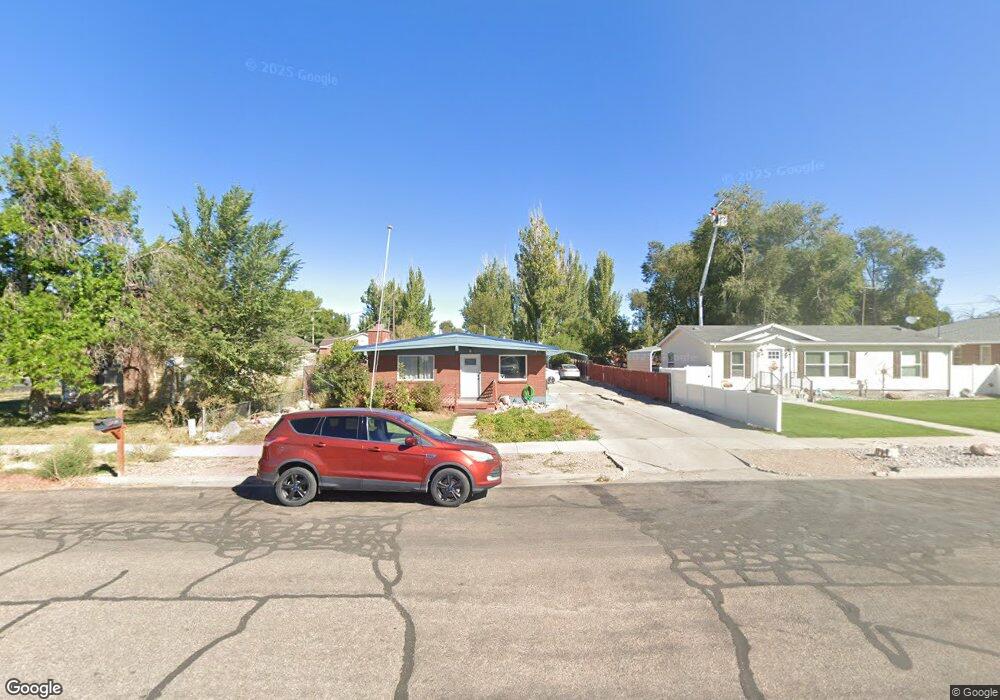
This home is located at 282 W 100 N, Delta, UT 84624 and is currently estimated at $317,942, approximately $141 per square foot. 282 W 100 N is a home located in Millard County with nearby schools including Cba Center and White River Academy.
Ownership History
Date
Name
Owned For
Owner Type
Purchase Details
Closed on
Aug 28, 2023
Sold by
Painter Joshua
Bought by
Salvatierra Walter Igna
Current Estimated Value
Home Financials for this Owner
Home Financials are based on the most recent Mortgage that was taken out on this home.
Original Mortgage
$304,385
Outstanding Balance
$297,110
Interest Rate
6.78%
Mortgage Type
FHA
Estimated Equity
$20,832
Purchase Details
Closed on
Feb 22, 2023
Sold by
Painter Joshua and Painter Jennifer
Bought by
Painter Joshua
Purchase Details
Closed on
Mar 11, 2005
Sold by
Midfirst Bank
Bought by
Secretary Of Housing And Urban Developme
Purchase Details
Closed on
Mar 7, 2005
Sold by
Lundberg Scott and Garcia-Rios Edgar
Bought by
Midfirst Bank
Create a Home Valuation Report for This Property
The Home Valuation Report is an in-depth analysis detailing your home's value as well as a comparison with similar homes in the area
Home Values in the Area
Average Home Value in this Area
Purchase History
We collect this data history from publicly available records. To have your information removed, we recommend requesting removal directly through your county’s website.
| Date | Buyer | Sale Price | Title Company |
|---|---|---|---|
| Salvatierra Walter Igna | -- | First American Title Insurance | |
| Painter Joshua | -- | First American Title Insurance | |
| Secretary Of Housing And Urban Developme | -- | First American Title Insuran | |
| Midfirst Bank | $95,170 | First American Title Insuran |
Source: Public Records
Mortgage History
We collect this data history from publicly available records. To have your information removed, we recommend requesting removal directly through your county’s website.
| Date | Status | Borrower | Loan Amount |
|---|---|---|---|
| Open | Salvatierra Walter Igna | $304,385 |
Source: Public Records
Tax History
| Year | Tax Paid | Tax Assessment Tax Assessment Total Assessment is a certain percentage of the fair market value that is determined by local assessors to be the total taxable value of land and additions on the property. | Land | Improvement |
|---|---|---|---|---|
| 2025 | $1,399 | $149,506 | $15,375 | $134,131 |
| 2024 | $1,399 | $127,577 | $12,068 | $115,509 |
| 2023 | $1,726 | $127,577 | $12,068 | $115,509 |
| 2022 | $1,230 | $92,478 | $12,616 | $79,862 |
| 2021 | $1,041 | $74,734 | $9,540 | $65,194 |
| 2020 | $969 | $69,112 | $8,672 | $60,440 |
| 2019 | $861 | $61,464 | $8,030 | $53,434 |
| 2018 | $793 | $57,052 | $8,030 | $49,022 |
| 2017 | $820 | $56,818 | $7,796 | $49,022 |
| 2016 | $794 | $56,818 | $7,796 | $49,022 |
| 2015 | $793 | $56,818 | $7,796 | $49,022 |
| 2014 | -- | $56,689 | $7,796 | $48,893 |
| 2013 | -- | $56,689 | $7,796 | $48,893 |
Source: Public Records
Map
Nearby Homes
Your Personal Tour Guide
Ask me questions while you tour the home.