282 W 100 S Smithfield, UT 84335
Estimated Value: $404,548 - $433,000
4
Beds
2
Baths
2,016
Sq Ft
$205/Sq Ft
Est. Value
About This Home
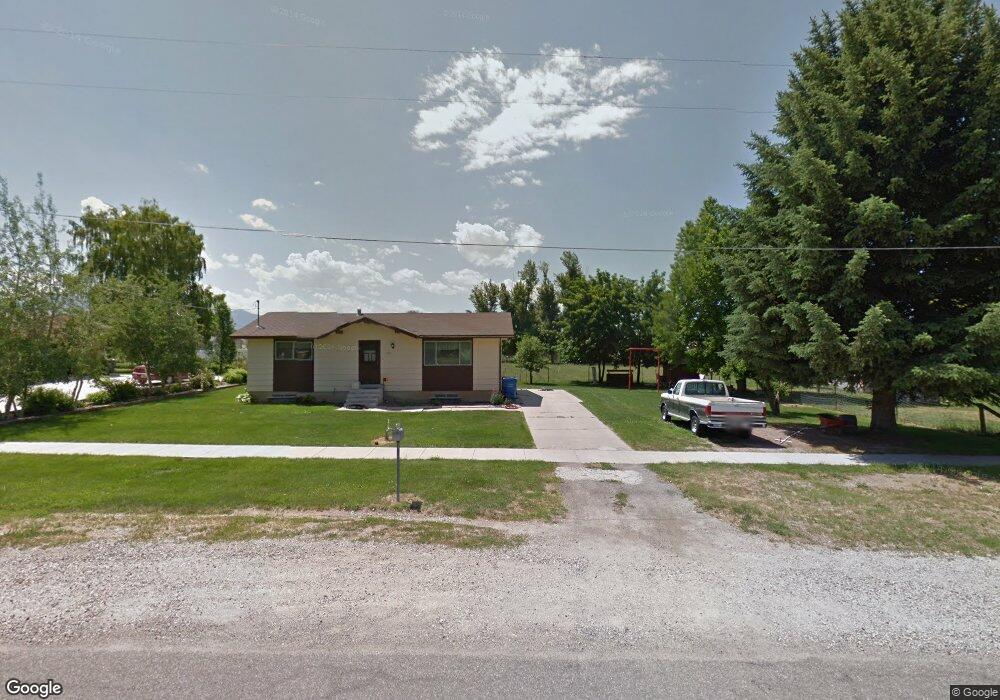
This home is located at 282 W 100 S, Smithfield, UT 84335 and is currently estimated at $413,637, approximately $205 per square foot. 282 W 100 S is a home located in Cache County with nearby schools including Summit School, Cedar Ridge School, and Cedar Ridge Middle School.
Ownership History
Date
Name
Owned For
Owner Type
Purchase Details
Closed on
May 20, 2019
Sold by
Ridgepoint Construction Inc
Bought by
Mattson Justin and Merrill Tabatha
Current Estimated Value
Home Financials for this Owner
Home Financials are based on the most recent Mortgage that was taken out on this home.
Original Mortgage
$257,575
Outstanding Balance
$225,528
Interest Rate
4.1%
Mortgage Type
USDA
Estimated Equity
$188,109
Purchase Details
Closed on
Aug 22, 2018
Sold by
Richman Boyd L
Bought by
Ridgepoint Construction Inc
Home Financials for this Owner
Home Financials are based on the most recent Mortgage that was taken out on this home.
Original Mortgage
$125,000
Interest Rate
4.5%
Mortgage Type
Purchase Money Mortgage
Purchase Details
Closed on
Aug 6, 2009
Sold by
A+ 24 Hour Bail Bonds
Bought by
Richman Boyd L and Richman Helen A
Create a Home Valuation Report for This Property
The Home Valuation Report is an in-depth analysis detailing your home's value as well as a comparison with similar homes in the area
Home Values in the Area
Average Home Value in this Area
Purchase History
| Date | Buyer | Sale Price | Title Company |
|---|---|---|---|
| Mattson Justin | -- | American Secure Title Logan | |
| Ridgepoint Construction Inc | -- | American Secure Title Logan | |
| Richman Boyd L | $5,000 | None Available |
Source: Public Records
Mortgage History
| Date | Status | Borrower | Loan Amount |
|---|---|---|---|
| Open | Mattson Justin | $257,575 | |
| Previous Owner | Ridgepoint Construction Inc | $125,000 |
Source: Public Records
Tax History Compared to Growth
Tax History
| Year | Tax Paid | Tax Assessment Tax Assessment Total Assessment is a certain percentage of the fair market value that is determined by local assessors to be the total taxable value of land and additions on the property. | Land | Improvement |
|---|---|---|---|---|
| 2025 | $1,510 | $202,160 | $0 | $0 |
| 2024 | $1,586 | $199,145 | $0 | $0 |
| 2023 | $1,659 | $196,975 | $0 | $0 |
| 2022 | $1,686 | $196,970 | $0 | $0 |
| 2021 | $1,634 | $291,640 | $70,000 | $221,640 |
| 2020 | $1,529 | $254,700 | $70,000 | $184,700 |
| 2019 | $1,102 | $174,913 | $45,000 | $129,913 |
| 2018 | $1,010 | $155,096 | $45,000 | $110,096 |
| 2017 | $940 | $78,815 | $0 | $0 |
| 2016 | $956 | $78,815 | $0 | $0 |
| 2015 | $960 | $78,815 | $0 | $0 |
| 2014 | $829 | $69,405 | $0 | $0 |
| 2013 | -- | $69,405 | $0 | $0 |
Source: Public Records
Map
Nearby Homes